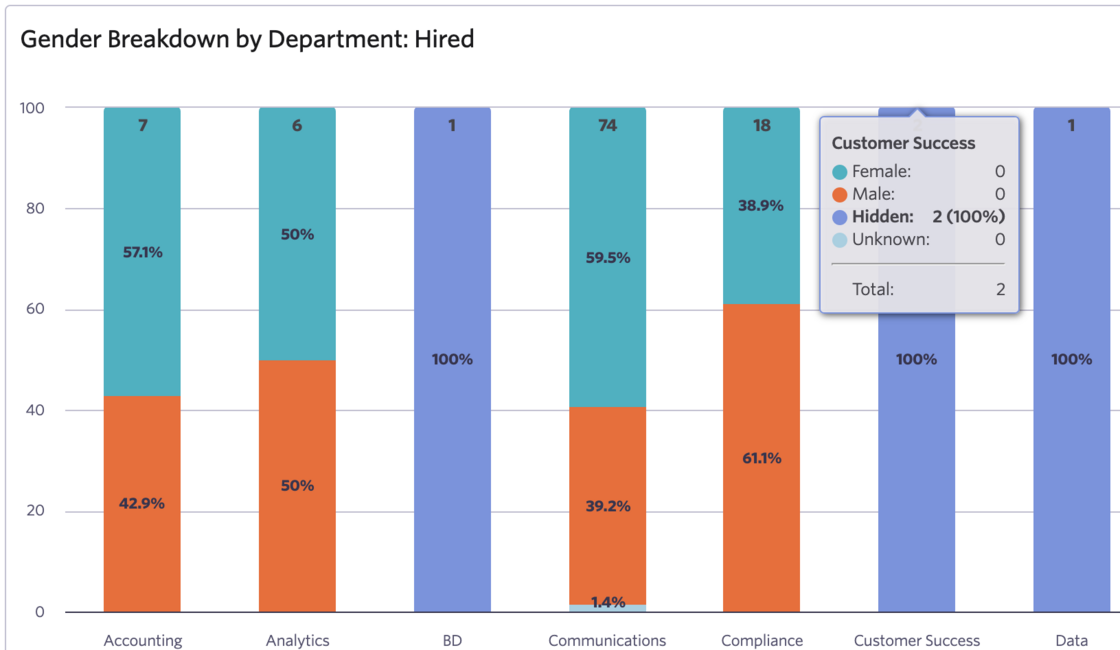
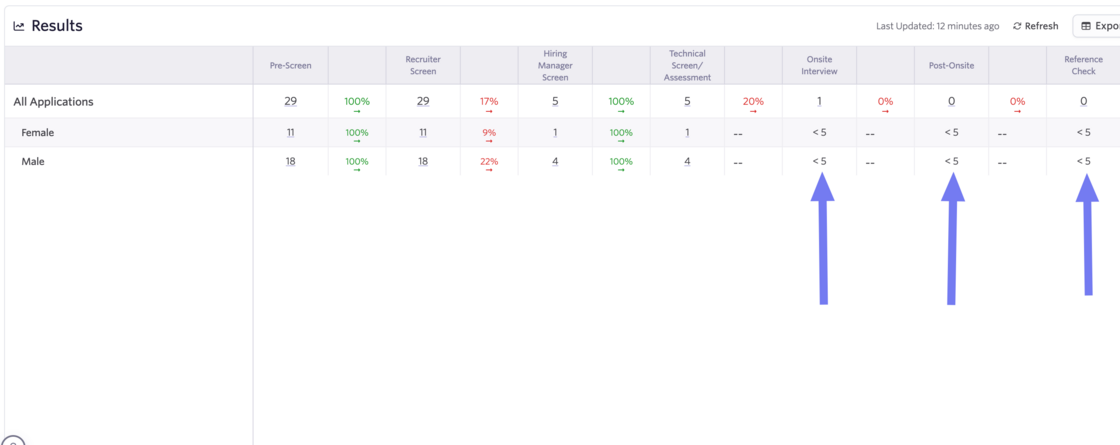
You can now set a threshold for displaying DEI results in your reports. When this threshold is not met the results will appear as hidden on your charts.
This helps ensure your reports only show DEI data when there is enough information to provide meaningful insights. This is particularly useful when dealing with low sample sizes.
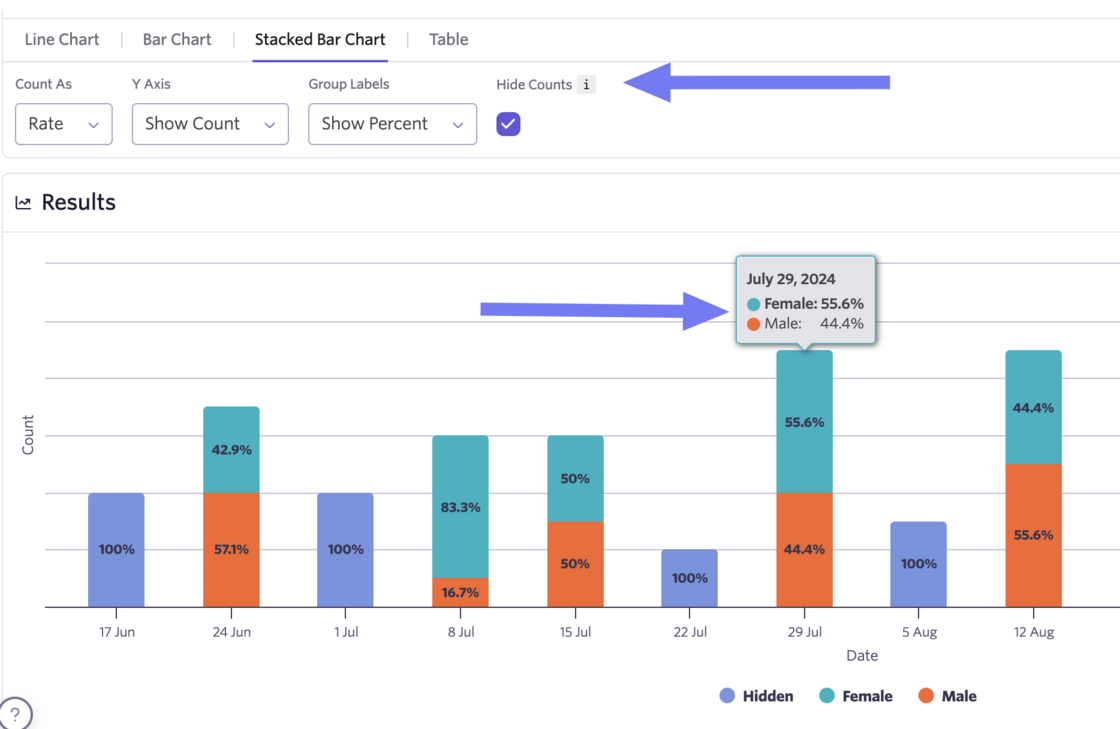
You also have the ability to completely hide counts at the chart level. Here you can see both hidden datasets due to threshold settings and hidden counts for raw numbers across all datasets.
Thresholds can apply to Count Over Time, Segmentation, and Passthrough Reports.