2023 Trends Report | Offer Acceptance Rates

6 minute read
You can also find this report here.
Benchmarking Offer Acceptance Rate
Top-performing talent acquisition teams are continuously improving and optimizing against their own benchmarks to drive towards top-line business goals. However, if you don’t have specific data yet or you want to see how your organization sits against industry norms, we analyzed over 10 million applications from Ashby customers from 2021 and 2022 to get you started.
This analysis is the first of many we will be releasing and focuses on Offer Acceptance Rates (‘OAR’) trends over a two year period.
We categorized the data across role types, sources, and time periods and applied our own interpretation regarding Offer Acceptance Rate (‘OAR’) over the past few years. We will continue to update these benchmarks as we gather more inputs and check in with talent experts.
We calculated the offer acceptance rate based on candidates entering the offer stage and evaluating their final outcome. We take this approach to control for bias related to when teams are more likely to create or not create official offers in the ATS (e.g. some teams tend to create offers only after verbal acceptance), while we additionally control for organization-based rejection reasons to identify what we believe is the most accurate measure of a candidate's decision to accept or reject an offer.
Subscribe to read upcoming benchmark reports and thought leadership from Ashby.
Key takeaways
Our analysis supports several trends related to Offer Acceptance Rate:
- Even as offer volume fluctuates with the market, OAR remains consistent
- Business roles have ~20 percentage points higher OAR than technical roles, even during layoffs
- Proportion of hires from inbound applications has increased
Below we highlight the data we analyzed regarding OAR and posit underlying reasons for the trends. We also share what steps you can take once you understand the data. For example, knowing why technical roles are harder to close than business ones can contribute to a differentiated hiring approach for each role type.
1. Even as offer volume fluctuates with the market, Offer Acceptance Rates remain consistent.
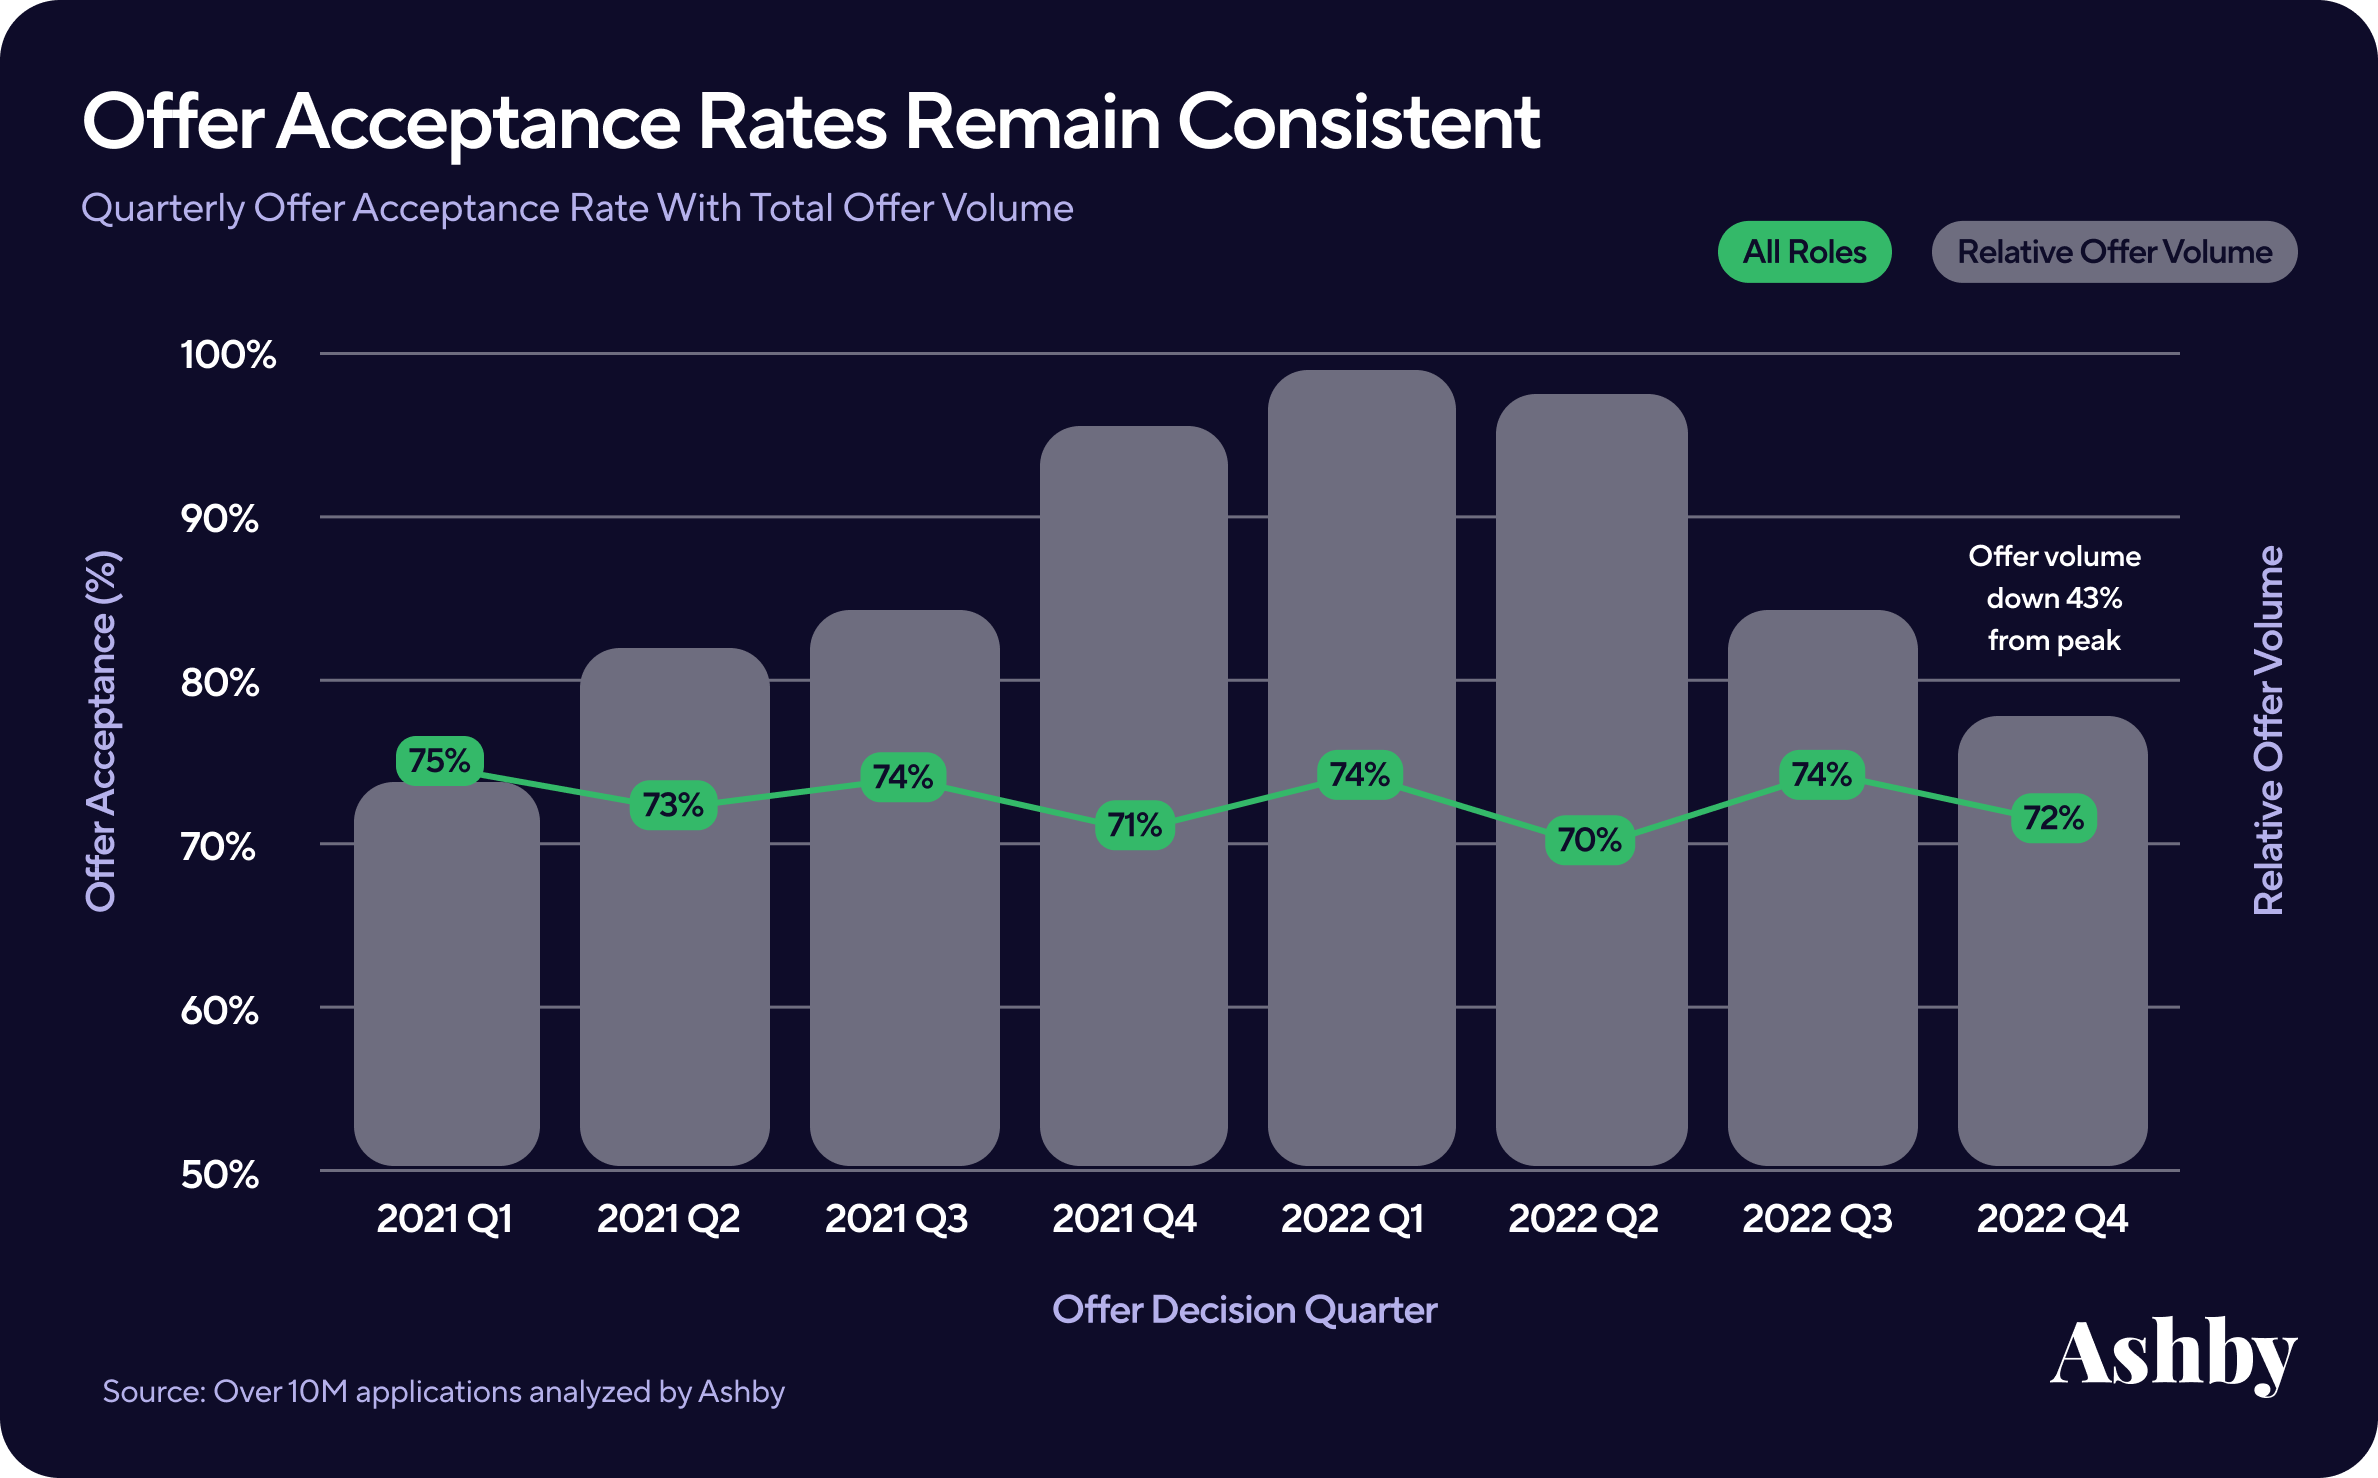
Any talent leader who has gone through a few recruiting cycles expects OAR to fluctuate quarterly and yearly, sometimes even monthly, if there are critical market events. However, OAR continues to be relatively stable over time, with slight variations possibly due to a number of factors.
Our data confirmed this trend: across Ashby customers, the overall OAR for 2022 was 73%, and the overall OAR for 2023 was the same at 73%. An overall rate over 66% means that more than 2 of every 3 offers were in fact accepted. That’s a comparatively high acceptance rate considering the less competitive market for job seekers than originally anticipated.
Next Steps
A rising OAR in Q1 2023 so far shows that like 2021 and 2022, the beginning of the year will see an increase in the overall rate. When rates spike like this, keep a close eye on the variation across role types, to ensure the blended rate is not masking any aberrations. Communicate predicted seasonal changes in OAR based on benchmarks, and set expectations that for many roles, hiring has not gotten much easier despite the “employer-friendly” market.
In addition, dig deep to understand why your OAR may have declined. In speaking to customers we’ve noticed that, while hiring has technically gotten less competitive, many candidates who are currently in a role are more hesitant to interview and join a different company at a time of wide-spread layoffs. Candidates are demanding a lot more information about a business’ performance, so be prepared to answer in-depth questions related to the stability and growth of the organization.
2. Business roles have ~20 percentage points higher Offer Acceptance Rate than technical roles, even during layoffs
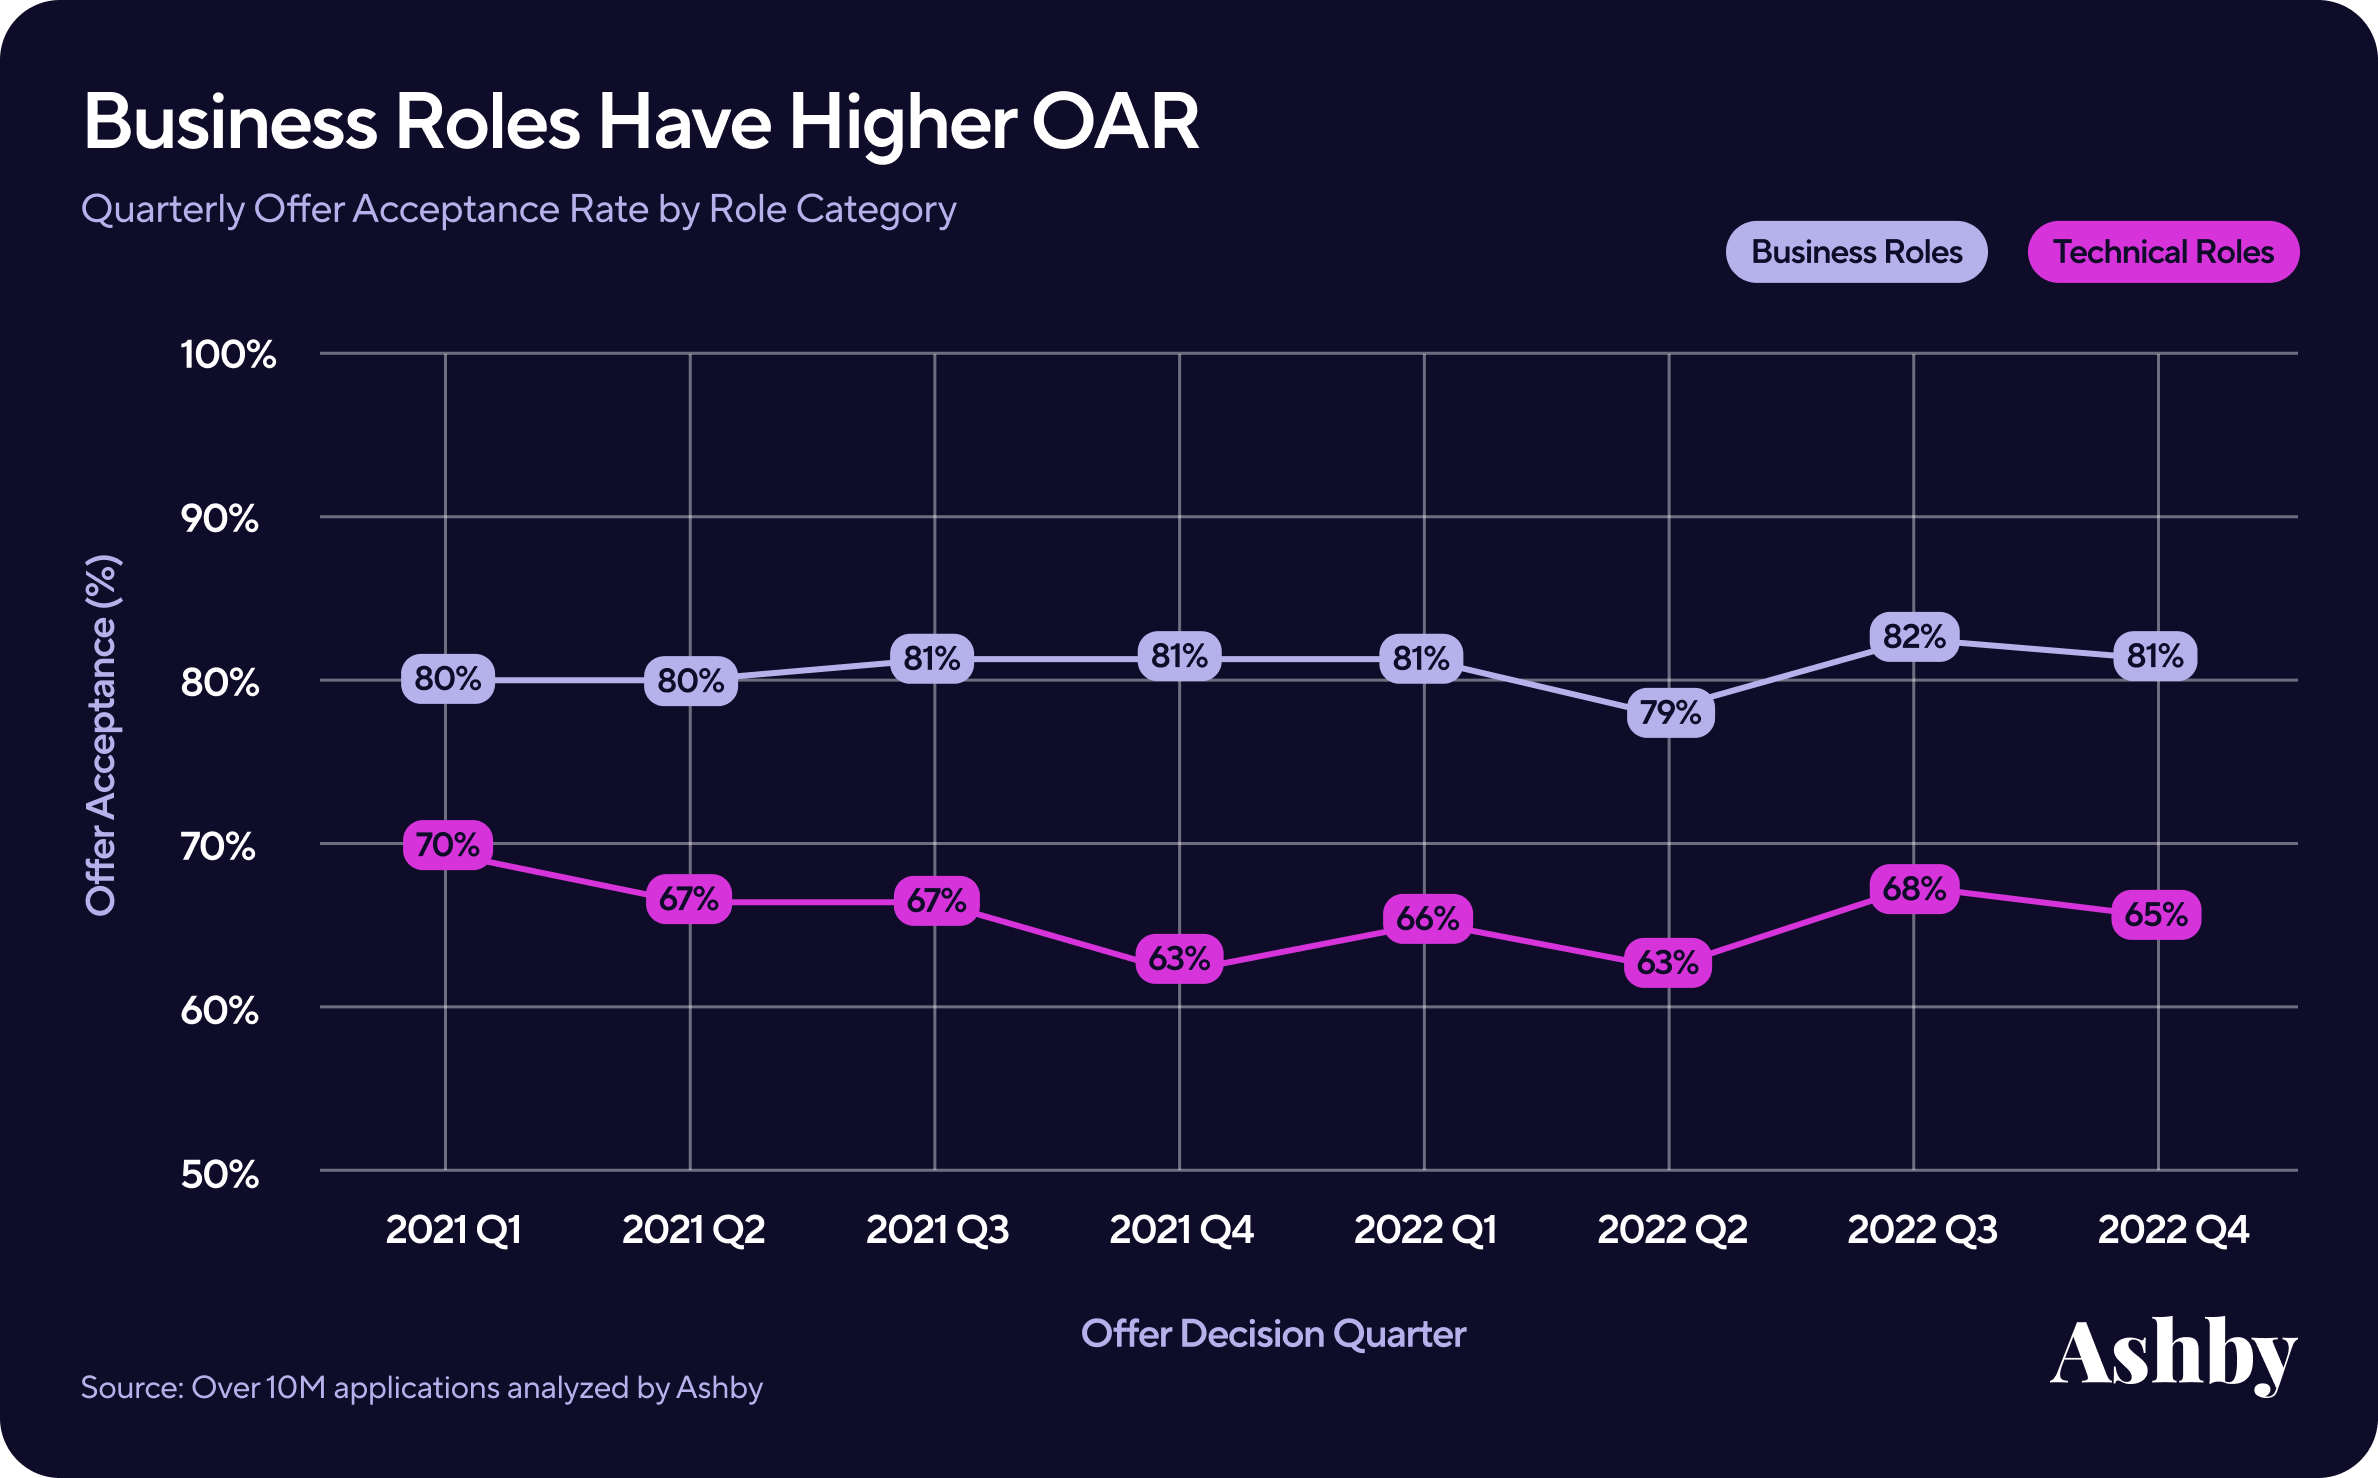
When we filtered offers by technical (engineering, data, product, design) versus business (customer success, sales, talent acquisition, marketing, ops, finance), we found a persistent and significant gap between OAR, with business roles having a ~20% higher OAR than technical ones. The gap is resilient - it has maintained the same over the past several years with no divergence, with engineering being the job category with the lowest OAR over time.
Quantifying this gap supports what recruiters have observed informally: that the highly competitive market for technical roles often results in lower rates across the board - email open rates, interviews booked, and offer acceptances to name a few. And this remains true even in this “employer friendly” talent market.
Next Steps
A consistently low OAR for technical roles means those candidates evaluate and approach their roles differently. Conduct as much direct research as you can with candidates who rejected the offer to find out why they did not accept, incorporate those reasons into a powerful candidate experience survey, and tailor them per job category type.
In addition, do not make assumptions about technical roles being easier to hire for during an employer-favored swing in the market. Instead, look at how you can engage and nurture candidates by being authentic and helpful in your communication.
3. Proportion of hires from inbound applications has increased
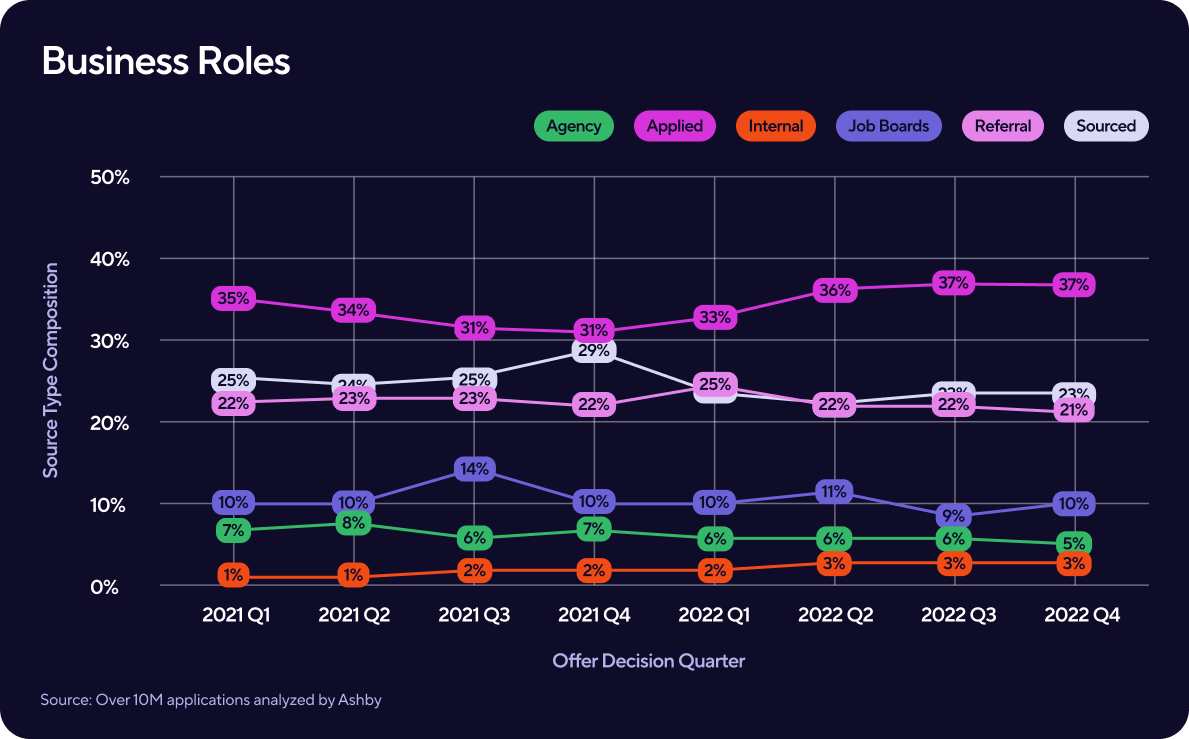
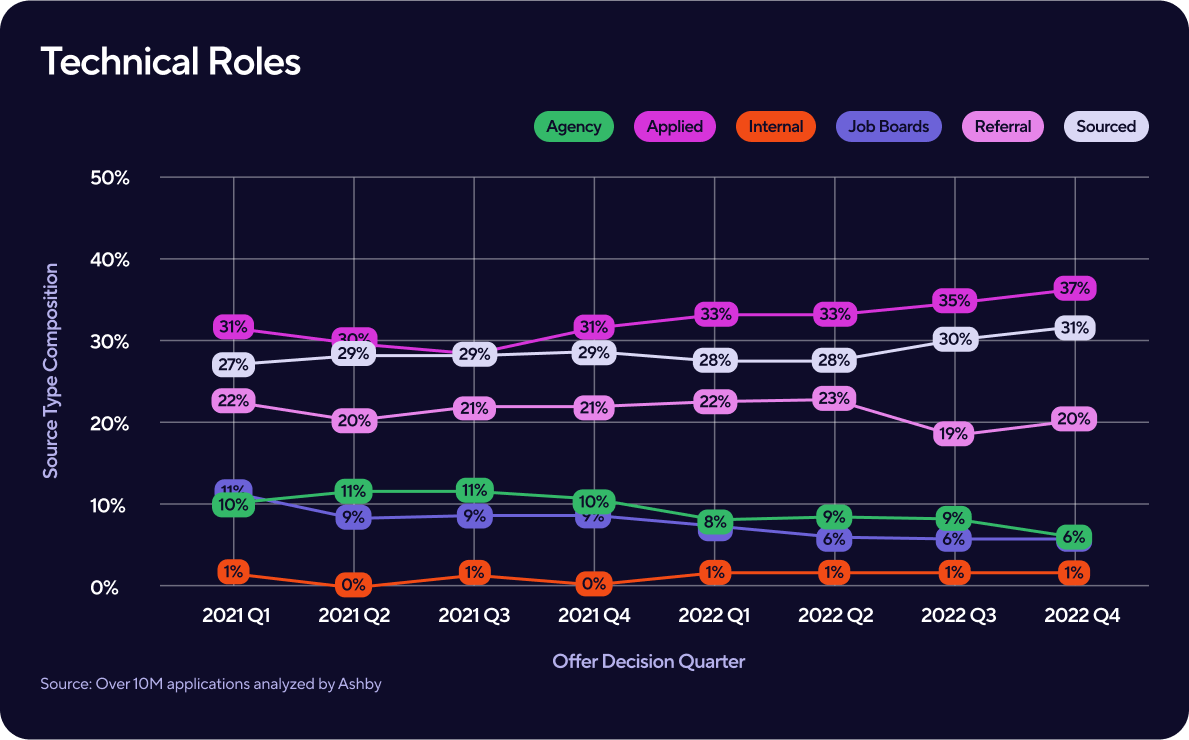
The source of the offer for hired candidates is a critical factor in OAR too, with agency and sourcing efforts reflecting that some of the most competitive candidates are the hardest to sign. OAR for agency and sourced candidates are the lowest across time, company size, and role type.
The fraction of agency-sourced candidates hired in particular decreased from Q4 2021 versus Q4 2022. With more candidates entering the market to apply to an overall smaller number of available jobs, the number of direct applications rose while agency hires trended down and sourced jobs have remained more or less flat. This trend holds across both business and technical roles. Our data shows that sourcing and agency resources predominantly go towards technical roles, while for business hires, we saw a higher percentage of hires come from direct applications.
Other insights from our data regarding sources:
- Job boards are decreasing for technical roles. This most likely corresponds with the expectation that during this market, there’s less engagement from employers with Indeed, Linkedin Premium, and other paid job boards
- Referrals appear to be trending down, which makes sense during an environment where talent are increasingly less willing to switch jobs
- Internal hiring appears to be slightly increasing, but we want to gather more data to finalize an interpretation of this (especially as it’s common practice to not thoroughly track internal hires in an ATS). It is noteworthy that business roles appear to make more internal hires compared to technical roles
A note about the data: for role category, we analyzed the total hires by the candidate source. By looking at the quarter to quarter changes, you can see how the composition of hires by their source changes.
Next Steps
A rise in direct applications means there will be more load on the talent acquisition team to manage candidates’ expectations and deliver on an exceptional candidate experience at scale. Make the effort to personalize templates for offers, rejections, and withdrawals to ensure the communication stays authentic and compassionate. Going the extra mile to refer a rejected candidate to another opportunity is excellent for long term reputational trust-building.
Lastly, assessing your hiring trends and re-assessing your overall sourcing strategy is always a dynamic necessity. This could mean examining the efficacy of your referral program, considering an investment in an internal hires program, or any number of source-specific considerations.
Wrap up
As we gather more data on hiring in 2023, we look forward to analyzing if these trends stay consistent, and what surprises become norms.
Things we'll be watching in 2023:
- OAR gap between technical and business roles - will it narrow in this market?
- Time to offer
- Time to hire, and the candidate experience
- Interviews per hire
- Applications per job, especially when the posting is first listed
- Passthrough rates by role category
- Qualified candidate trends
- … and other benchmarks you want us to analyze!
You can find this report here.
Subscribe to read upcoming benchmark reports and thought leadership from Ashby.
Subscribe to Updates
Ashby products are trusted by recruiting teams at fast growing companies.