AI-powered report interpretations for clear, actionable insights

We're introducing AI Report Interpretations, giving you one-click access to summaries and key insights for reports in Ashby.
We've been investing in making reports easier to create and access across Ashby, from AI report building and job dashboards to core dashboards and our redesigned reporting UI.
As more users build and interact with reports, our next task is to help you better comprehend your analytics and quickly answer "what should I take away from this report?" so that you can move from insight to decision-making much faster.
AI Report Interpretations build on our reporting foundation to provide a concise summary of a report's configuration alongside generated insights, so you can easily confirm what a report covers to understand and communicate key takeaways to your stakeholders.
How it works
Explain report
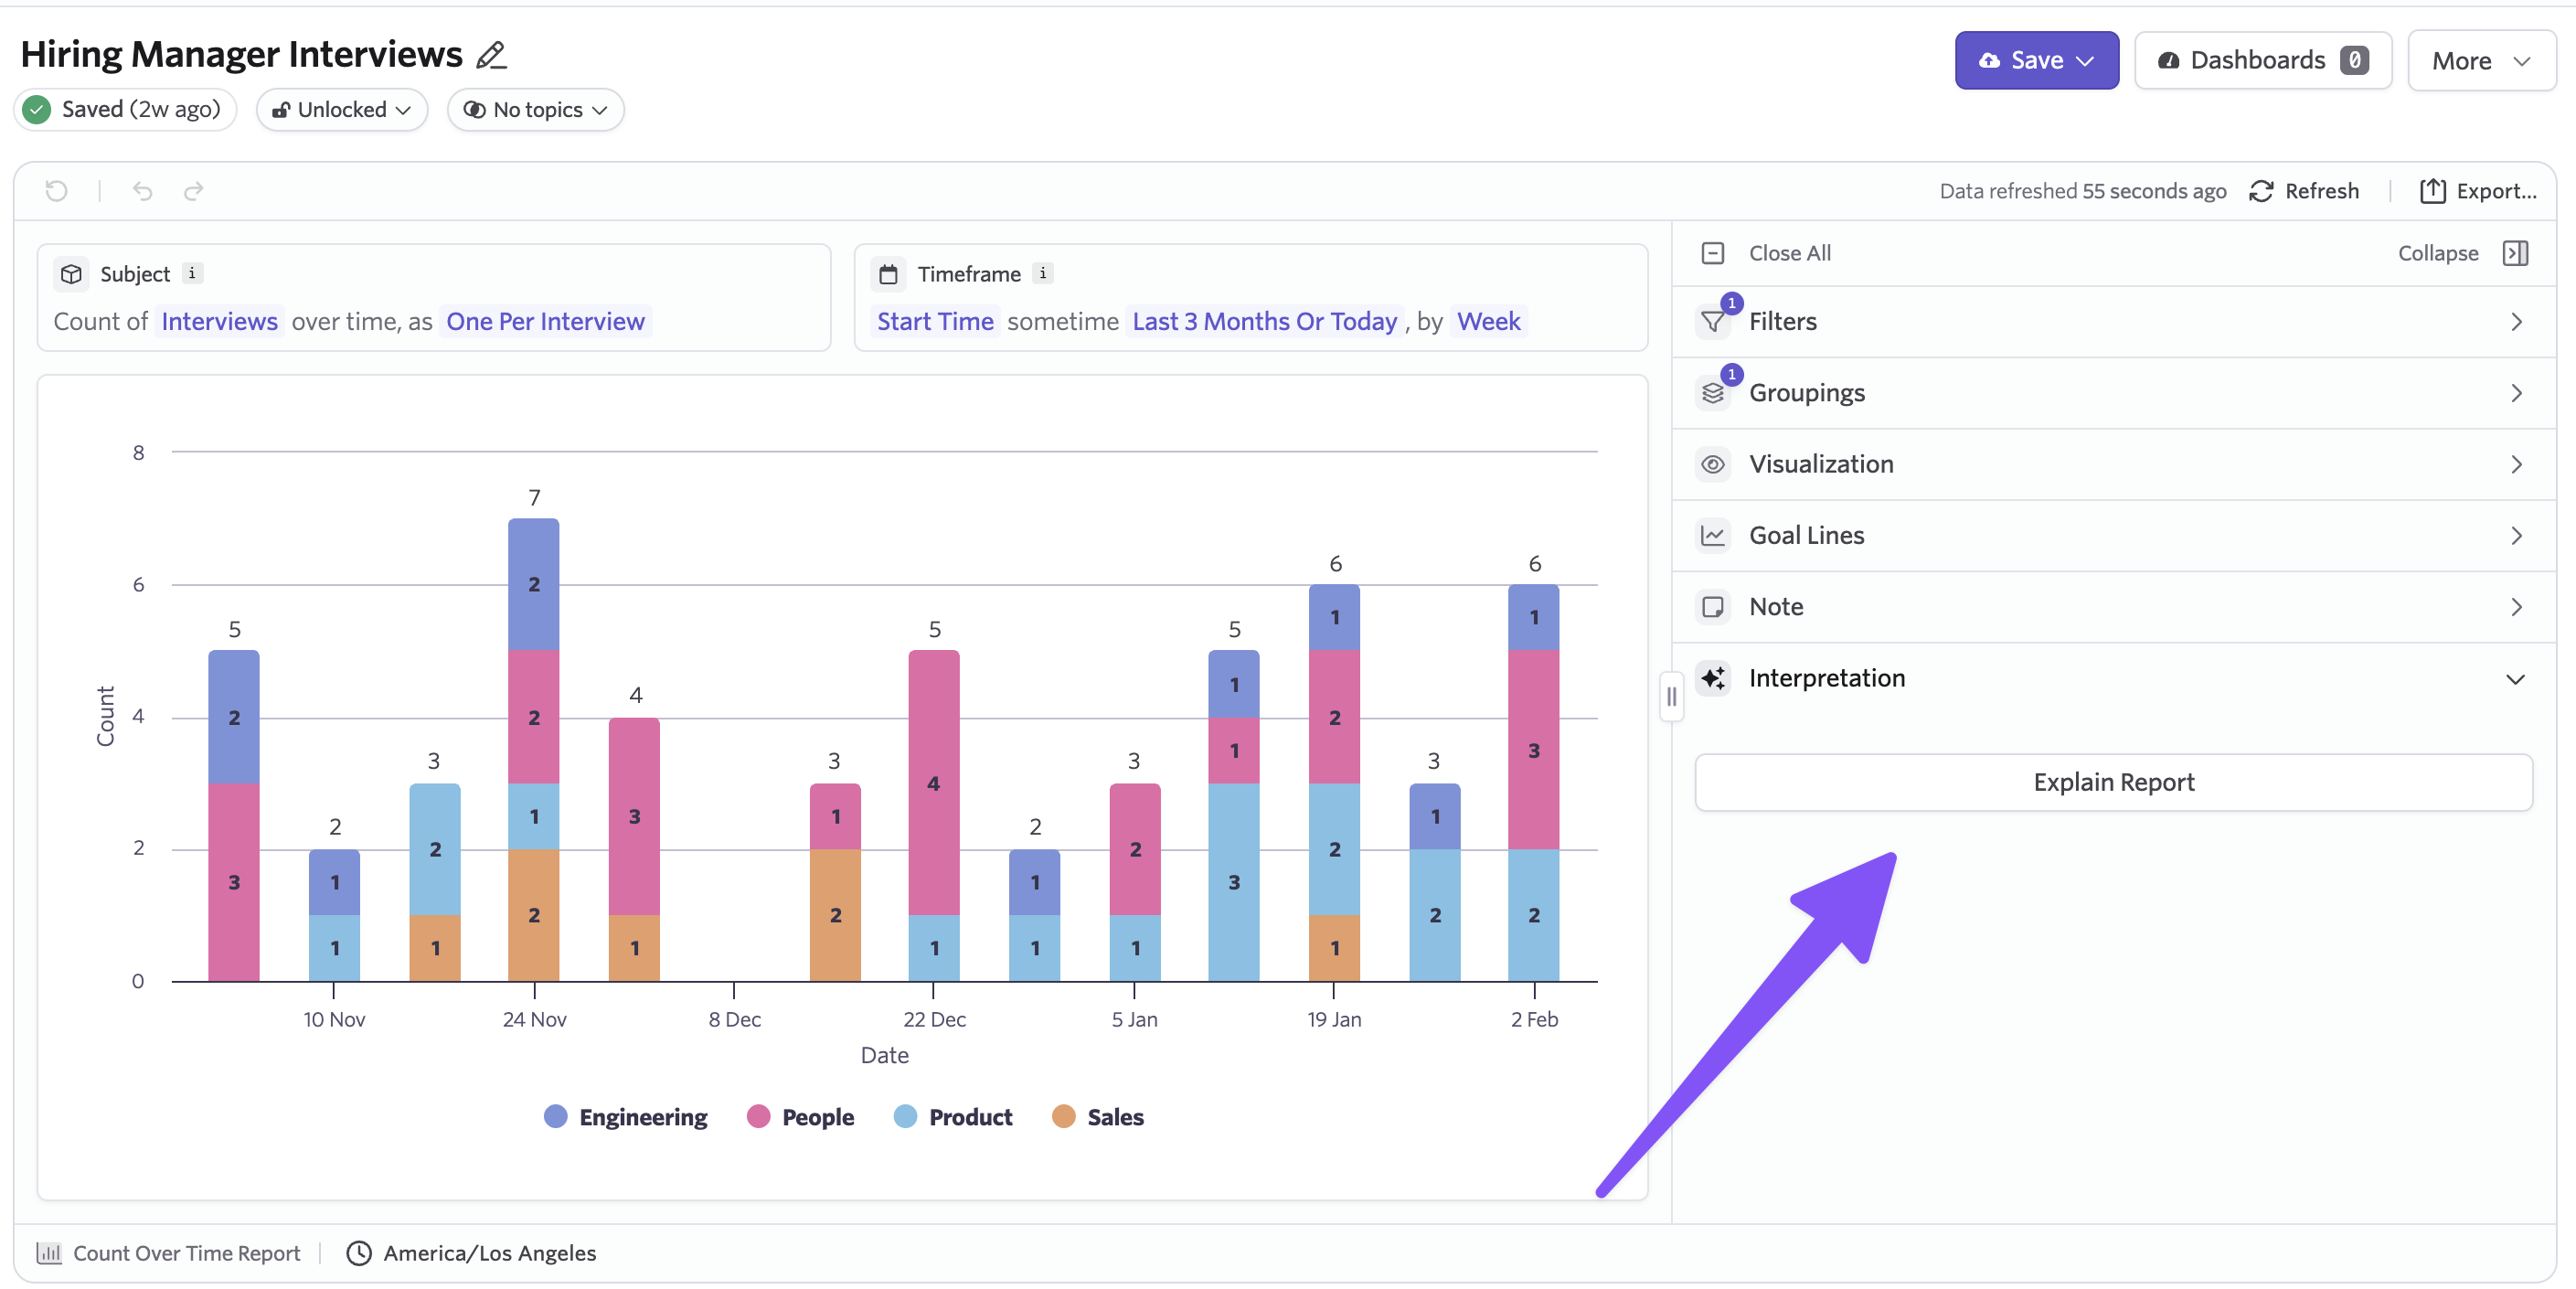
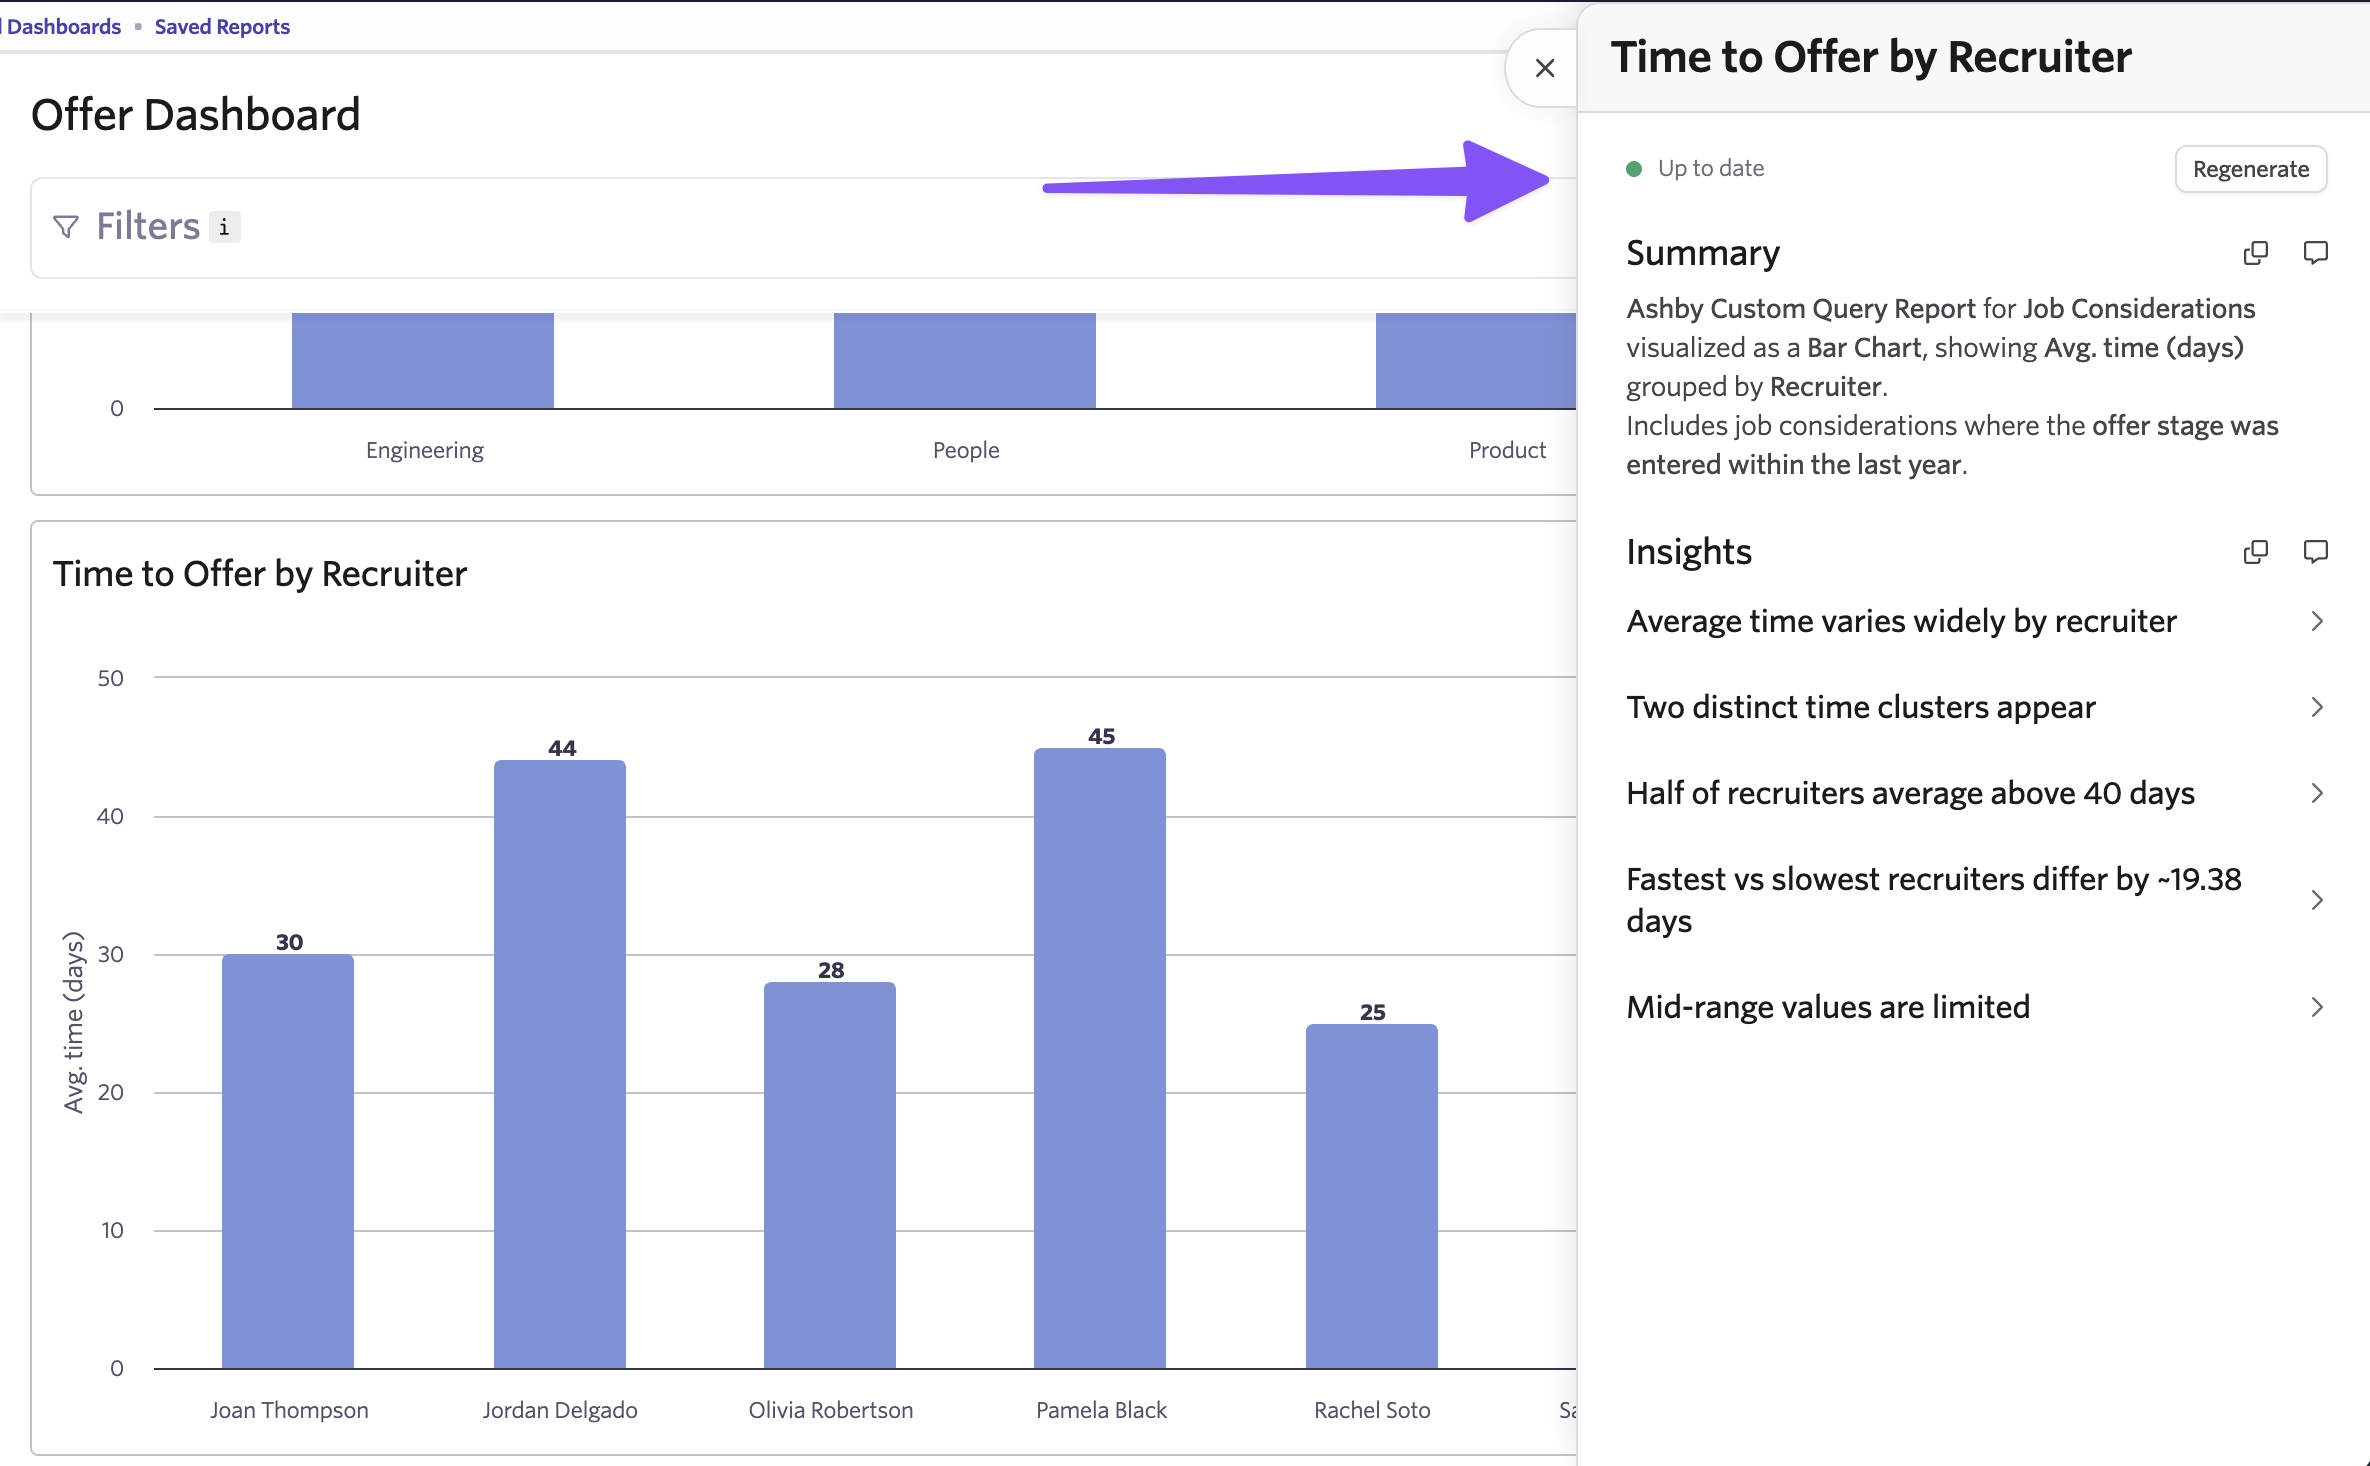
On your reports, you'll see a new "Explain Report" button in the "Interpretation" panel. When you click it, two things happen:
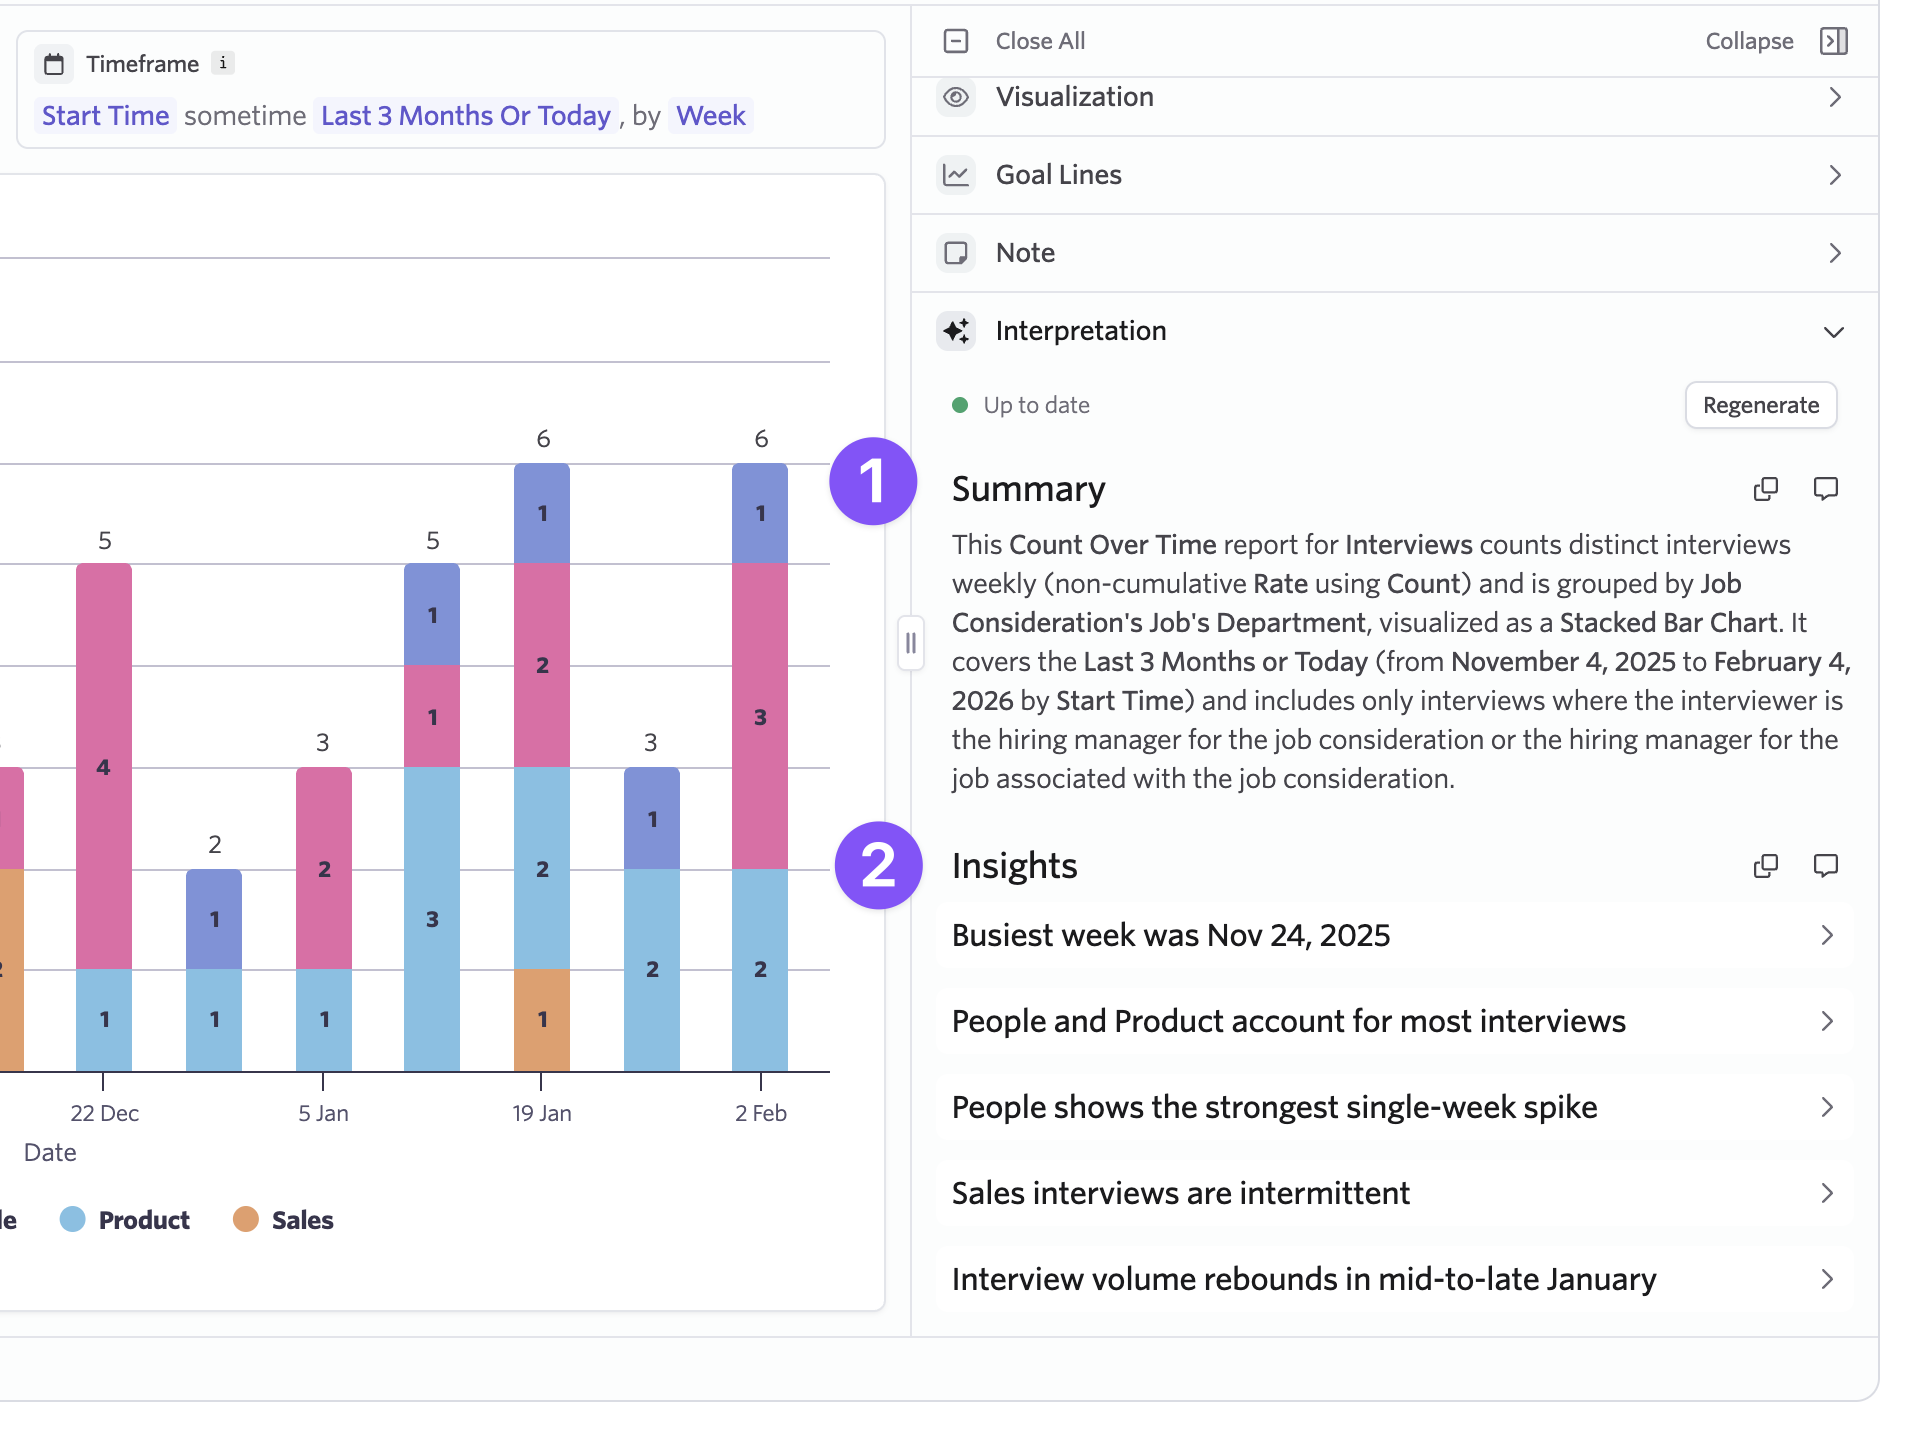
-
A high-level summary describes what the report is showing: the subject, time frame, filters, groupings, and visualization type.
-
AI-generated insights highlight notable patterns in the data, giving you a starting point for analysis across any report. Each insight references specific data points and can be expanded for detail and copied for sharing.
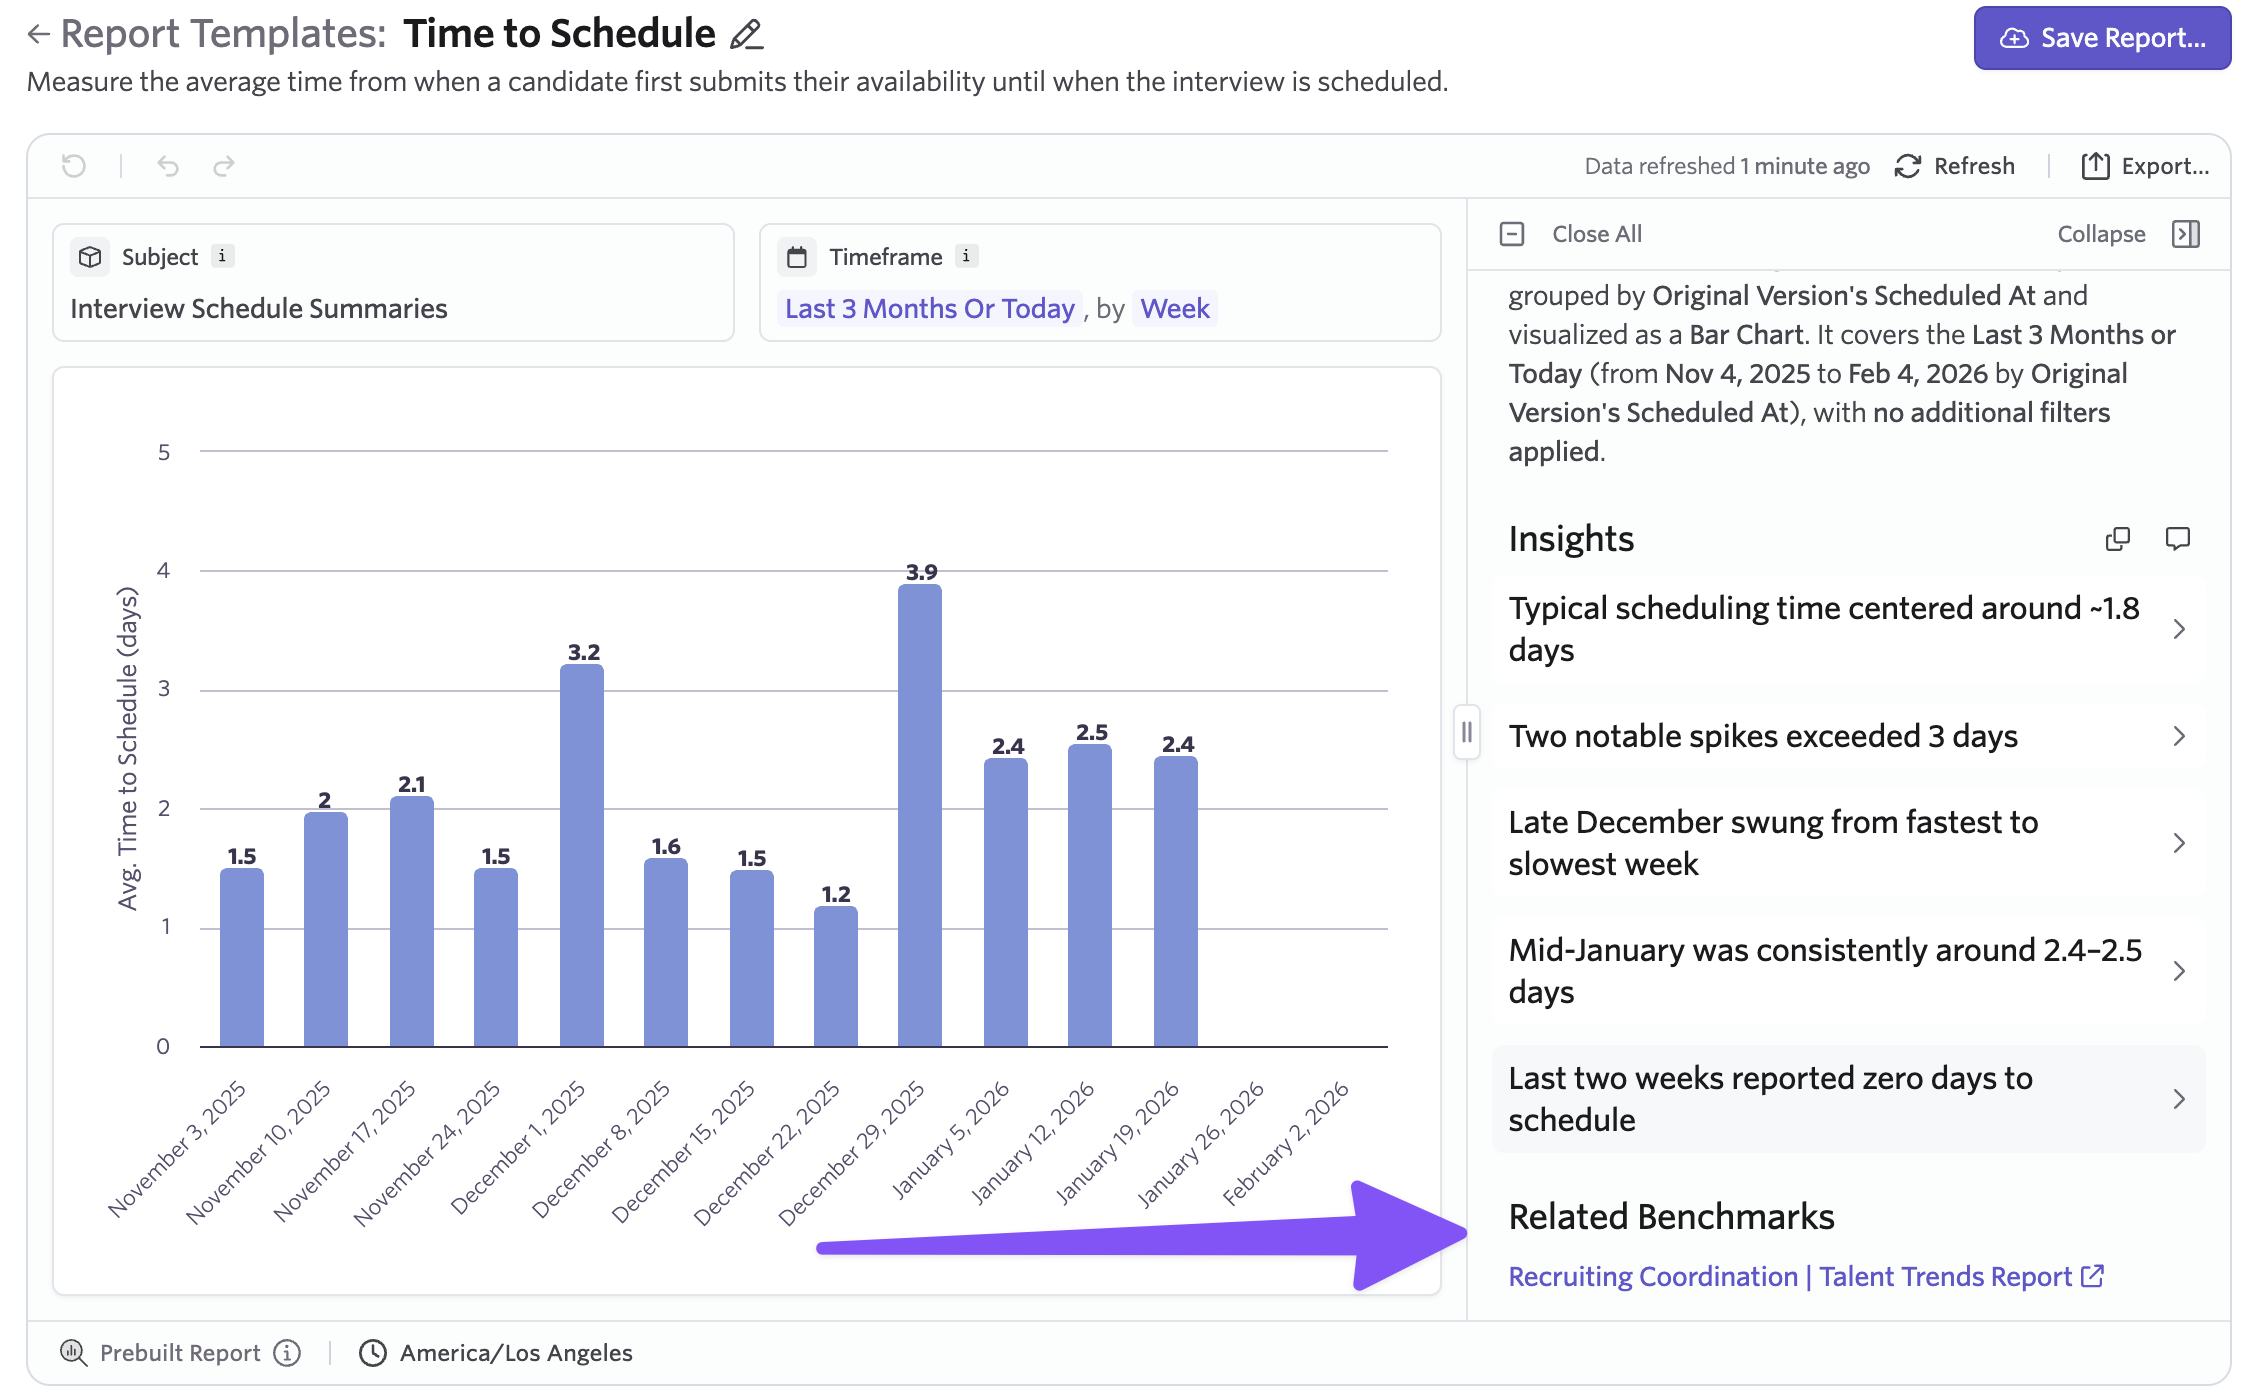
Where relevant, some insights will link directly to related Talent Trends benchmark reports helping you ground your data to industry benchmarks.
AI-Assisted titles and notes
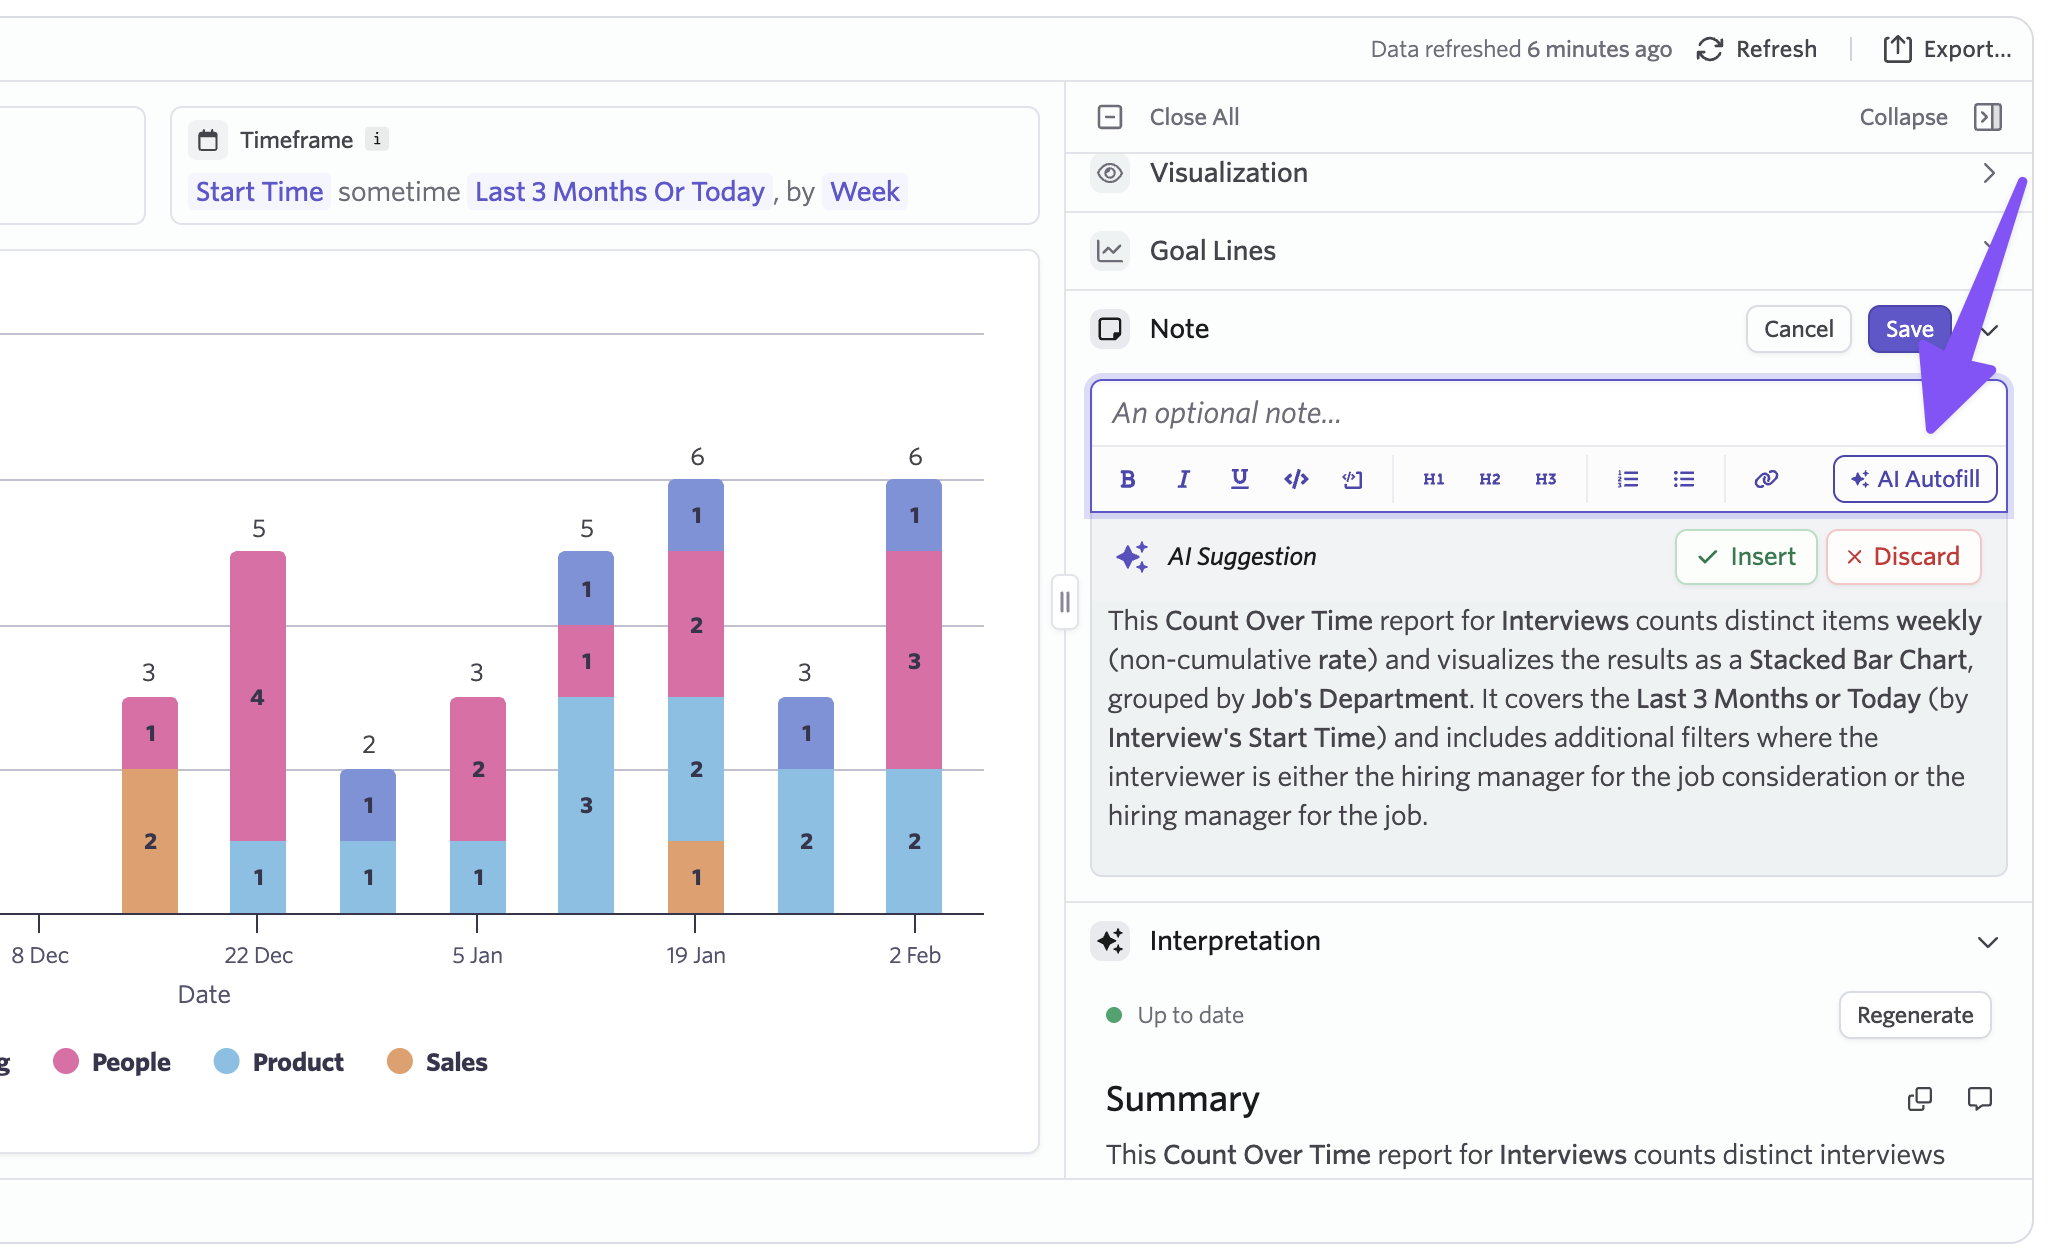
In addition to report interpretation, we're also adding AI-assisted generation for report titles and notes. The report note field now supports AI autofill, helping you create clear, descriptive summaries that make reports easier for others to understand at a glance.
Report titles also support AI generation, so giving a report an accurate and useful name takes less effort.
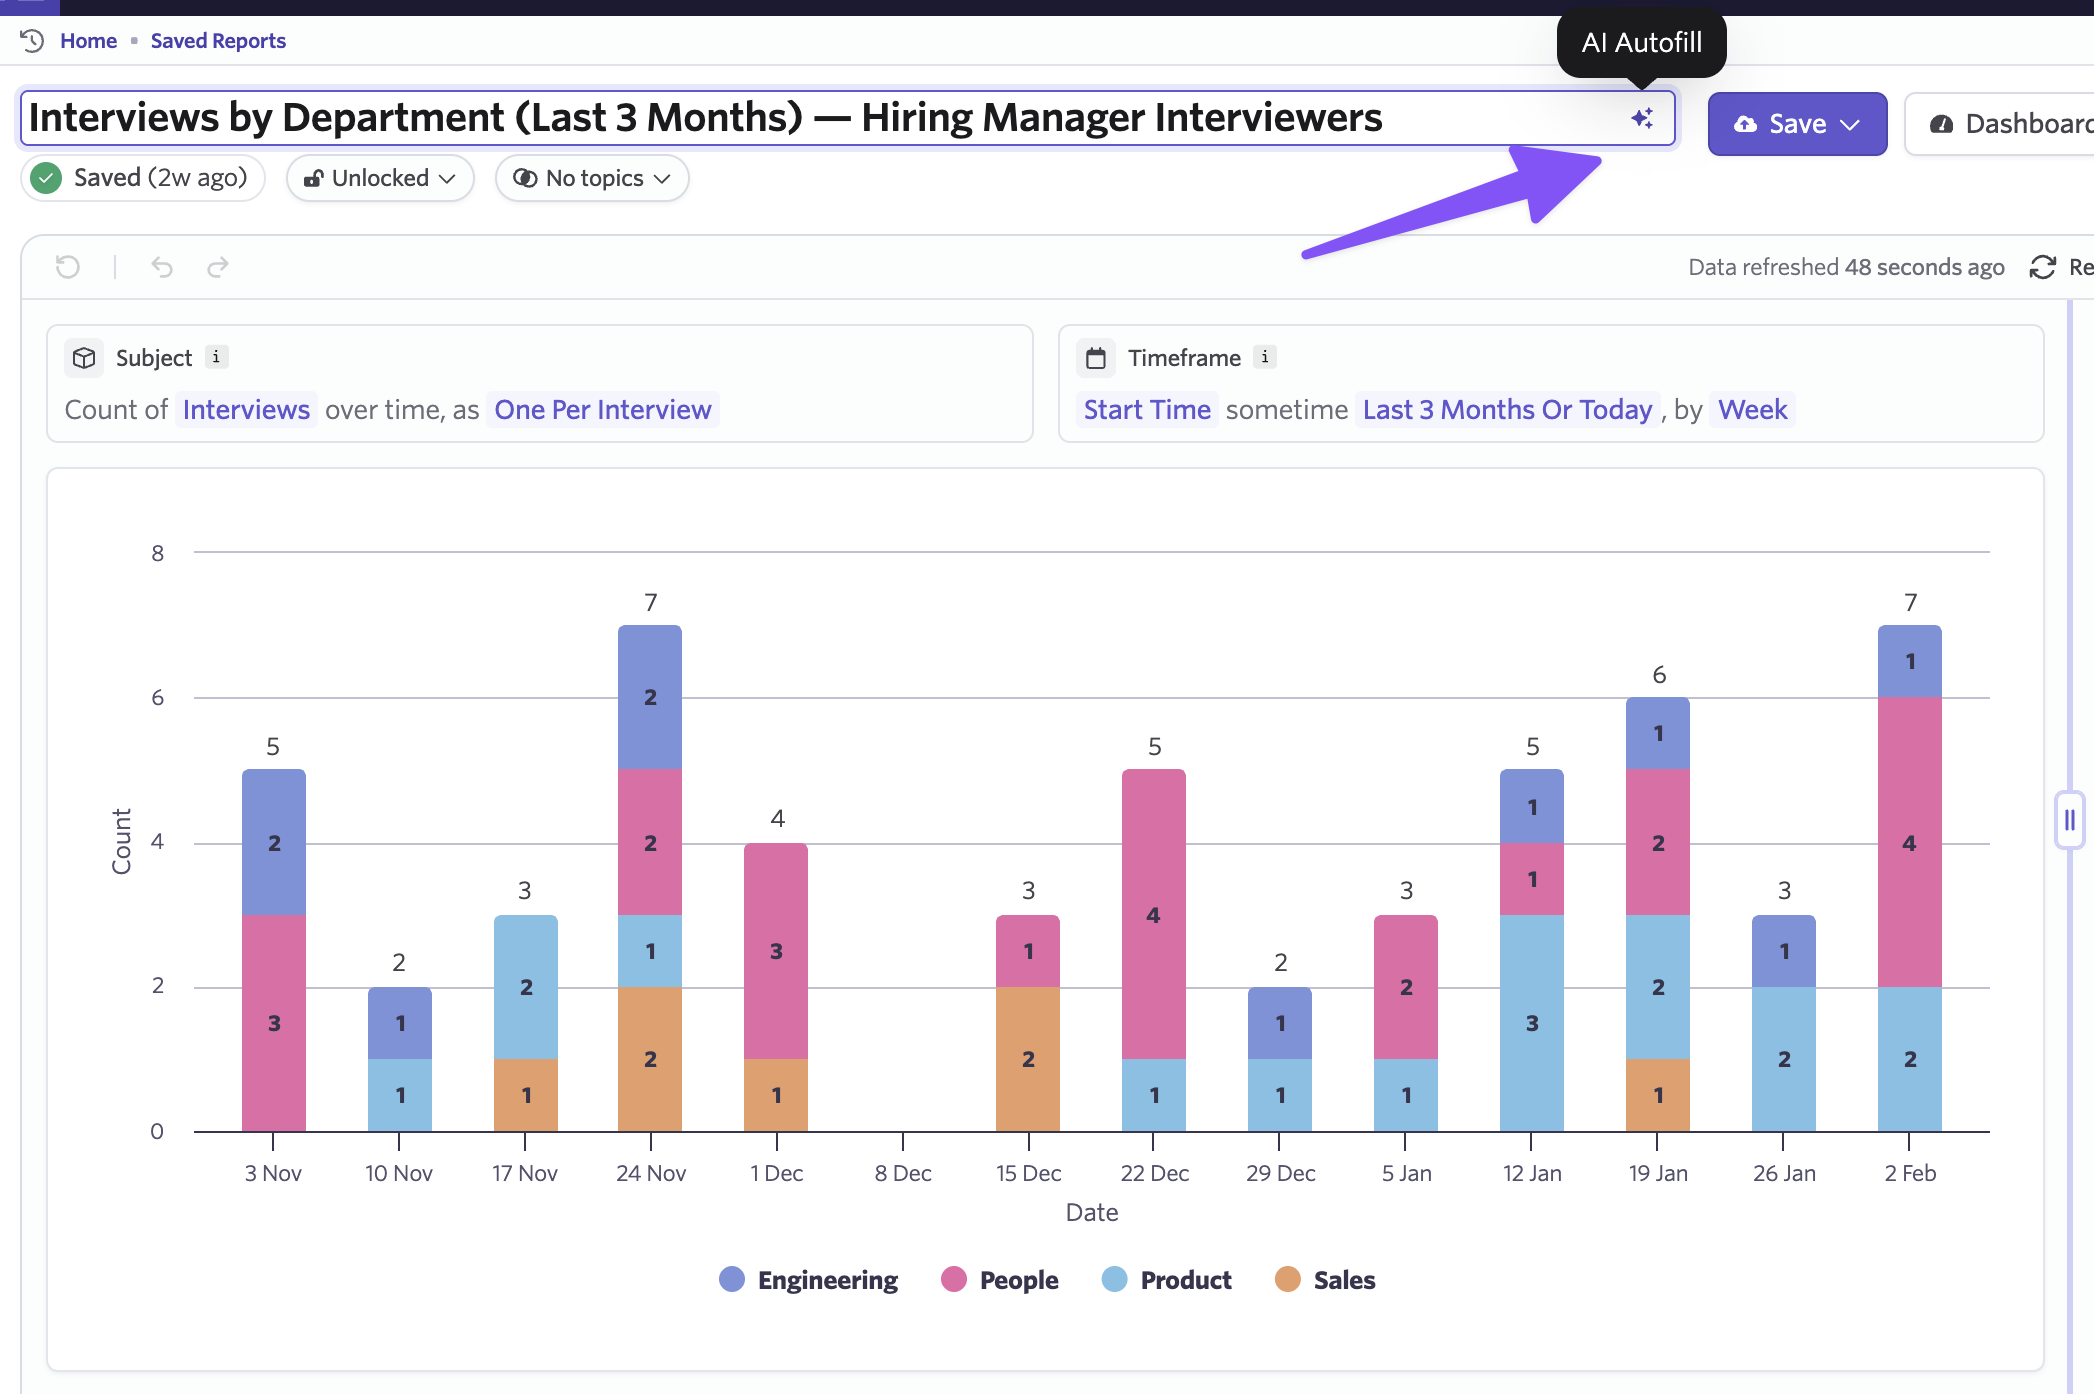
If you're building a report library that your team or hiring managers can self-serve from, clear titles and descriptions go a long way. AI-assisted generation helps you maintain that clarity in a consistent way, especially as the number of reports and dashboards you manage grows.
Dashboard Experience
AI Report Interpretations work on dashboards too. Each report tile on a dashboard has a new "Explain Report" option, so you can run an interpretation directly from the dashboard context.
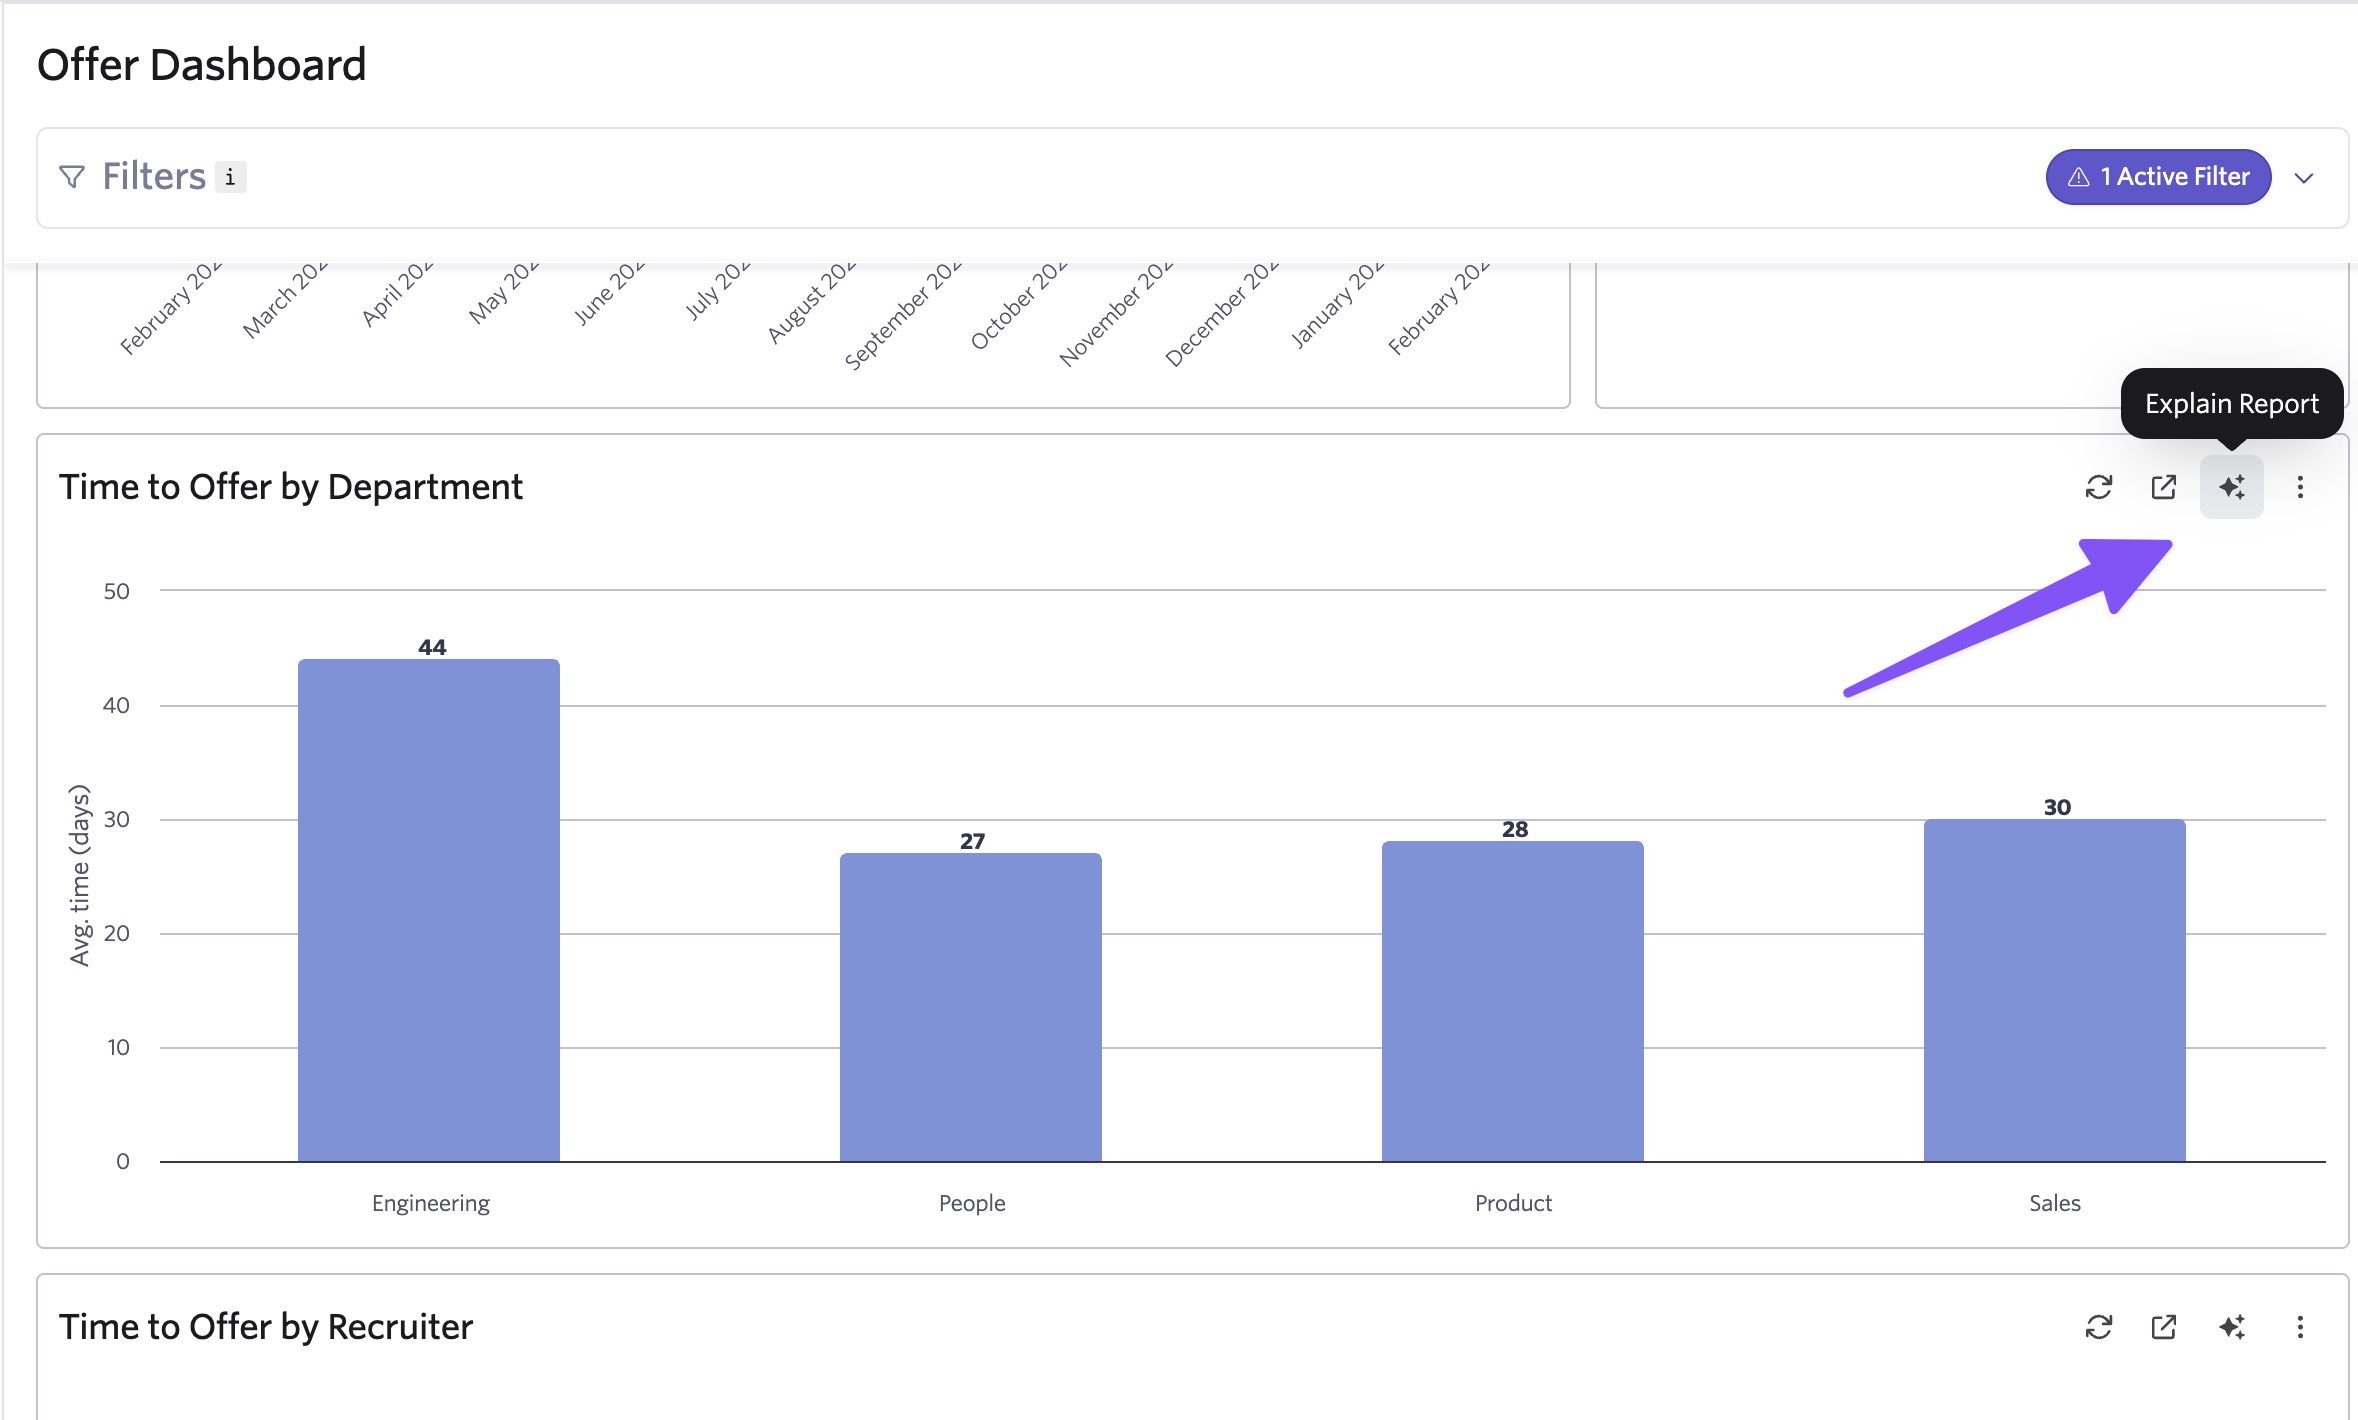
When you're reviewing a dashboard before a leadership sync or a weekly team check-in, knowing the exact scope of each report matters.
The interpretation reflects any filters applied, so you can confirm what you're looking at before presenting it. For example: "This time to offer by recruiter report is filtered to Engineering and Product departments, located in APAC."
Elevating report comprehension across your team
For anyone building or managing reports, these AI-powered report interpretations help communicate the filters, groupings, and timeframe of the reports you're building to newcomers and audiences that may not be intimately familiar with your reports.
For anyone reviewing or presenting reports, the insights give you ready-made talking points for stakeholder reviews or team syncs. They surface patterns like which source channels are underperforming, where application volume dropped, or which departments have diverse archive reasons, so you can walk into any conversation with specifics.
For teams sharing dashboards broadly, AI-generated Notes and clear titles help hiring managers and executives self-serve from dashboards. A hiring manager checking where their open roles stand, or a VP reviewing hiring health across departments, can read the note and interpretation to understand what the report covers without asking someone to walk them through it.
AI Report Interpretations add a meaningful comprehension layer helping everyone on your team understand and act on what they're seeing.
Open your reports and look for the "Explain Report" button in the interpretation panel, or try it from any report tile on a dashboard. You can learn more about this feature by heading to our knowledge base article or by booking a demo to see it in action.