Talent Trends Report | Candidate Experience Surveys

23 minute read
Topics
Table Of Contents
Candidate Experience Surveys have long been known as a tool for talent teams to evaluate their recruiting and application process. And while a number of best practices around around survey template questions to include, length of questionnaire, and more have been shared online, we sought to source some data-backed inspiration.
As we explored, we uncovered some less conventional wisdom around building these surveys including benchmarks for Candidate NPS, whether or not to anonymize responses, and the importance of customizing surveys across different hiring stages.
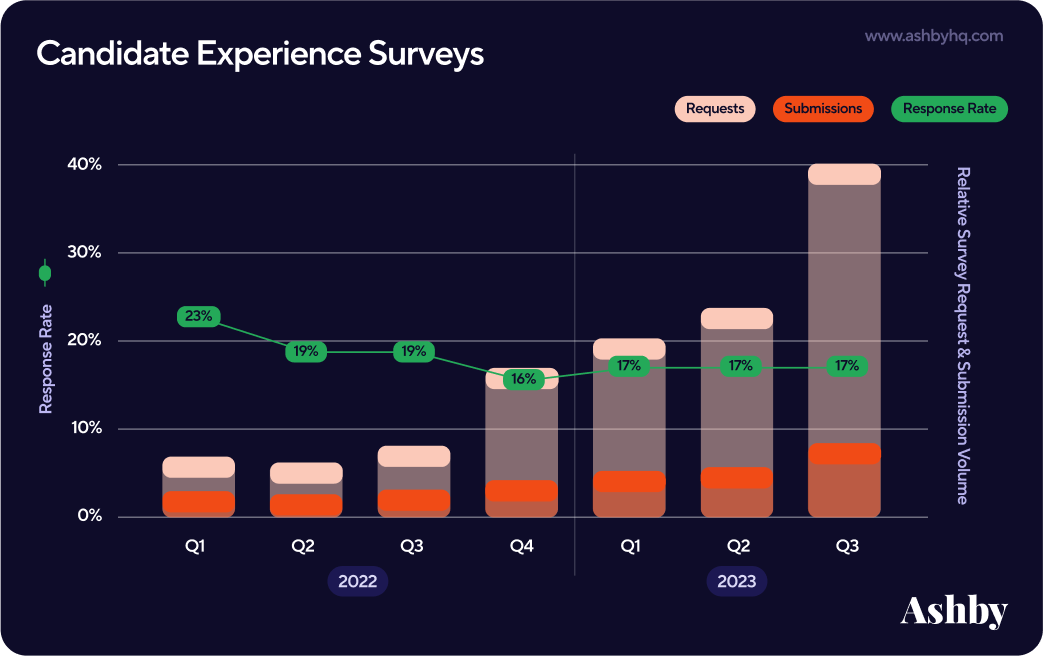
The data pulled in this analysis comes from 67.4K surveys requests sent and 11.9K survey responses received between January 2022 and October 2023 through Ashby Candidate Experience Surveys. Subscribe to our Talent Trends newsletter to receive a bite-sized insight in your inbox every week.
Average Response Rates
Let’s start by understanding the percentage of candidates that are likely to respond to your Candidate Experience Surveys. While the average response rate for the last year was roughly 17.8% [Tweet This], the fluctuation in data shows that response rates stayed steady between 16% to 19% from July 2022 to September 2023.
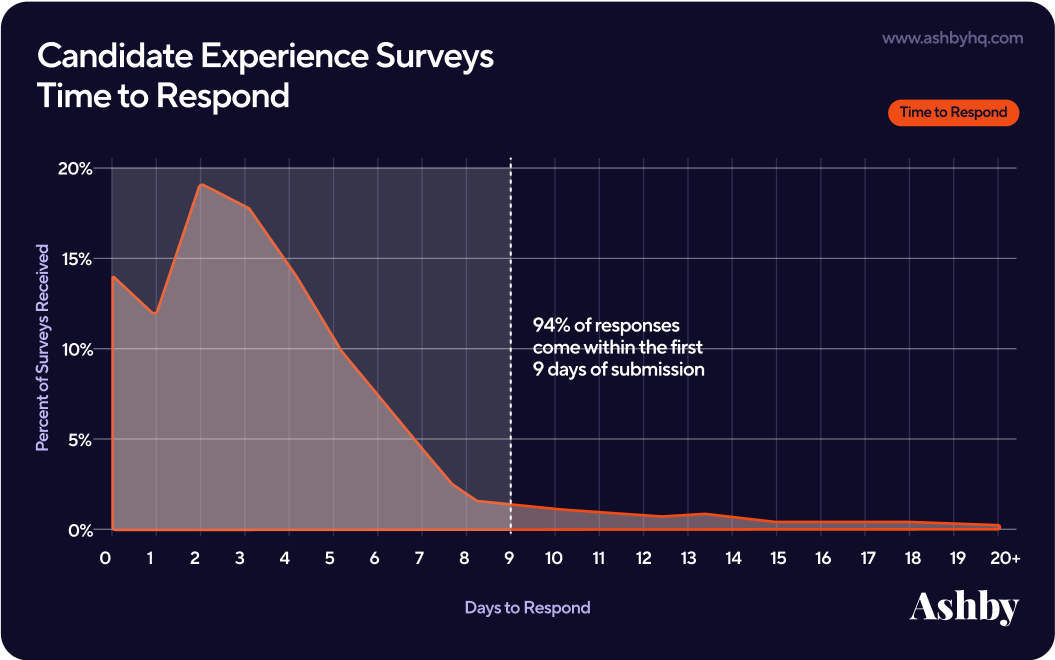
As we looked closer at the data, another interesting trend emerged: 94% of responses come within nine days of receiving the survey. [Tweet This]
Of course, response rate can depend on many factors including the interview experience itself, their final outcome, or the survey design. We'll unpack some of those considerations in the coming sections.
4 Stats on Candidate Survey Response Rates
Insight 1: Asking up to 10 Questions Leads to Highest Response Rate
The common advice for surveys of any flavor has always been “the shorter the better.” Our analysis showed an…
- 20.1% response rate when asking 1-5 questions
- 20.1% response rate when asking 6-10 questions
- 18.2% response rate when asking 11+ questions
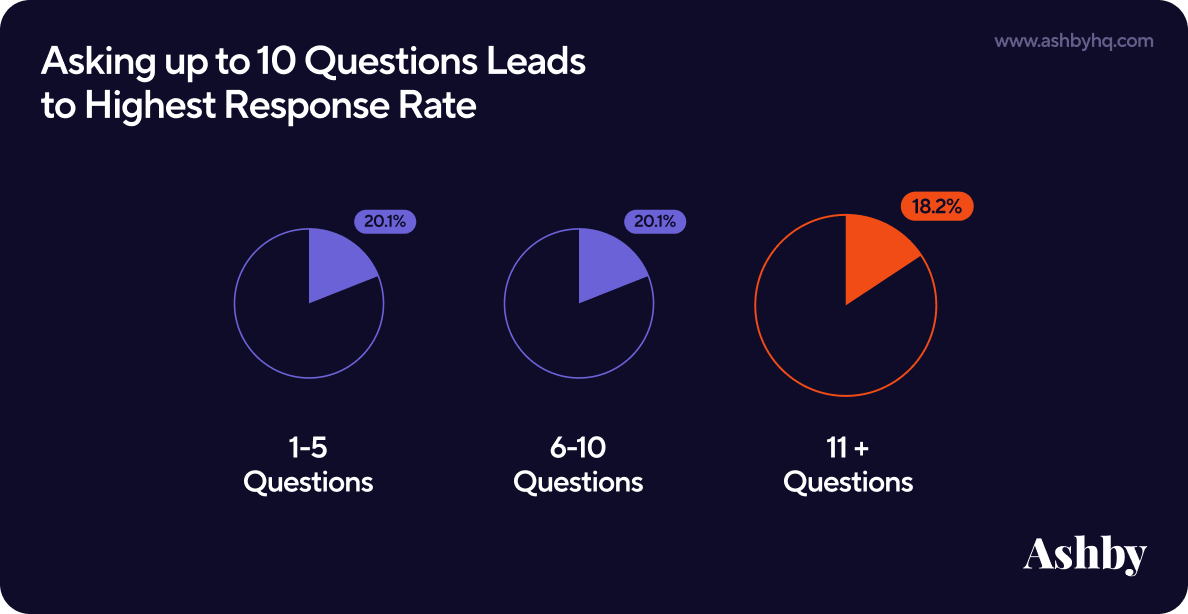
From what we’re observing, a more comprehensive approach to your survey design can still yield meaningful results and candidate satisfaction. Talent teams need to evaluate what data they want to capture (and why) to best determine the ideal number of questions for their efforts.
For example, you could choose to have a standard set of six questions as the base survey for data continuity, and then have additional questions that get added to the survey for specific audiences or segments where deeper analysis would benefit your interview feedback loops.
Insight 2: Higher Response Rates Come When Surveys Are Not Kept Anonymous
Anonymous feedback is the gold standard across surveys in most industries. Recruiting is a unique scenario to consider, where the human experiences of different groups, segments, and even individuals can be vital intel in improving a candidate's experience.
Like all aspects of survey design, the ultimate decision depends on your strategy. We looked at this data through the three submission modes Ashby allows when administering Candidate Experience Surveys.
Option 1: Allow Anonymous In this submission mode, candidates can opt into anonymous submission. Surveys with Allow Anonymous resulted in a 17.7% average response rate.
Option 2: Do Not Allow Anonymous ★ In this submission mode, all survey responses will be tied to the candidate and available on their Candidate Profile within Ashby. Surveys that didn’t allow anonymous responses resulted in the highest response rate at 20.6%.[Tweet This]
Option 3: Enforce Anonymous In this submission mode, all responses are automatically guaranteed to be anonymous. Surveys with always anonymous responses received the lowest response rate an average of 15.3%.
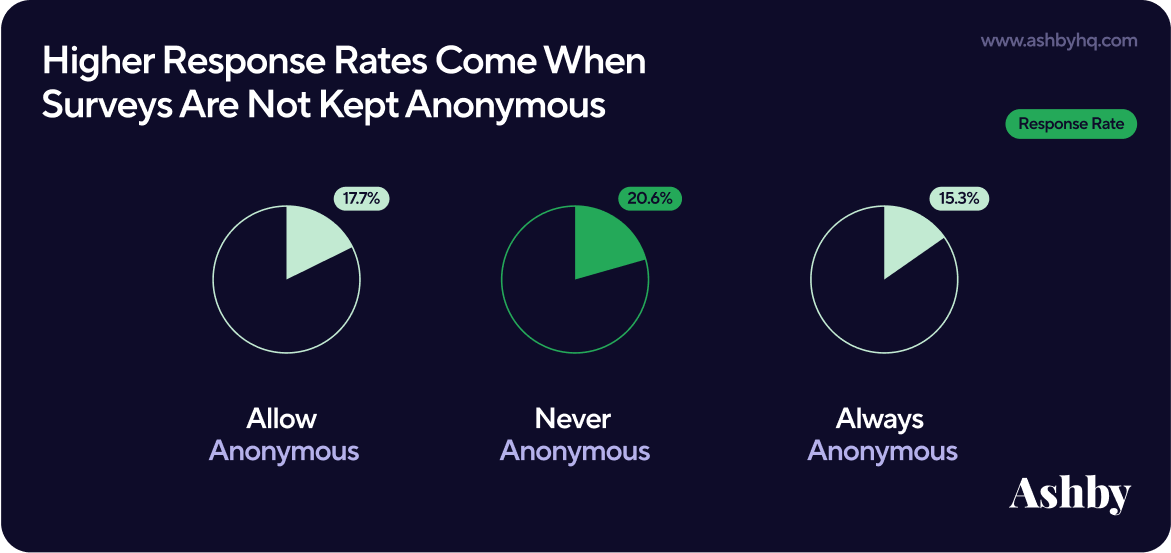
💡Talent Leader Insight: M-KOPA is among the Ashby customers who doesn’t allow for anonymous survey submission. Global Talent Acquisition Manager Daniel King believes that context is deeply important for extracting valuable insights. Knowing which candidate submitted what information allows him to tie the responses to the specific situations the candidate experienced. In the rare case something egregious leads to a negative experience, he wants to be able to understand the root cause or even reach out with the proper outreach if necessary.
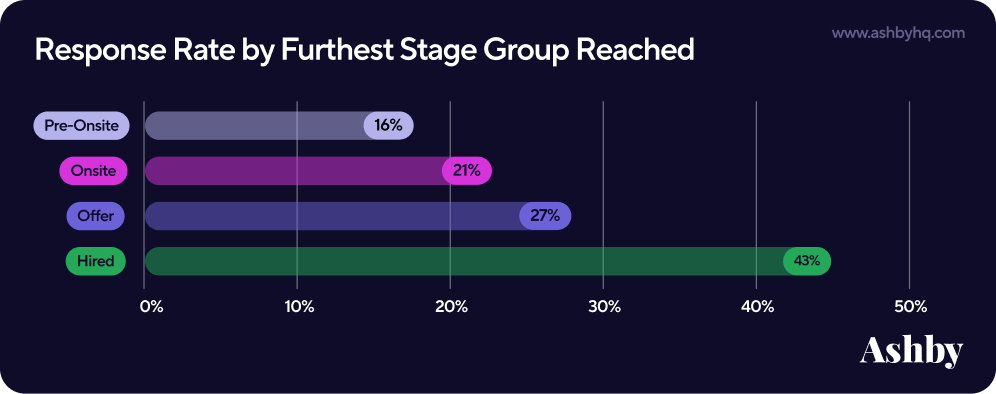
Insight 3: Response Rates are Highest for Hired Candidates
Our findings here point to what most would intuitively assume.
- Response rates are lowest for candidates who don’t make it past the initial screen
- Response rates are highest for candidates who are ultimately hired ★
- Response rates begin to dip and generally even out for all remaining later stages
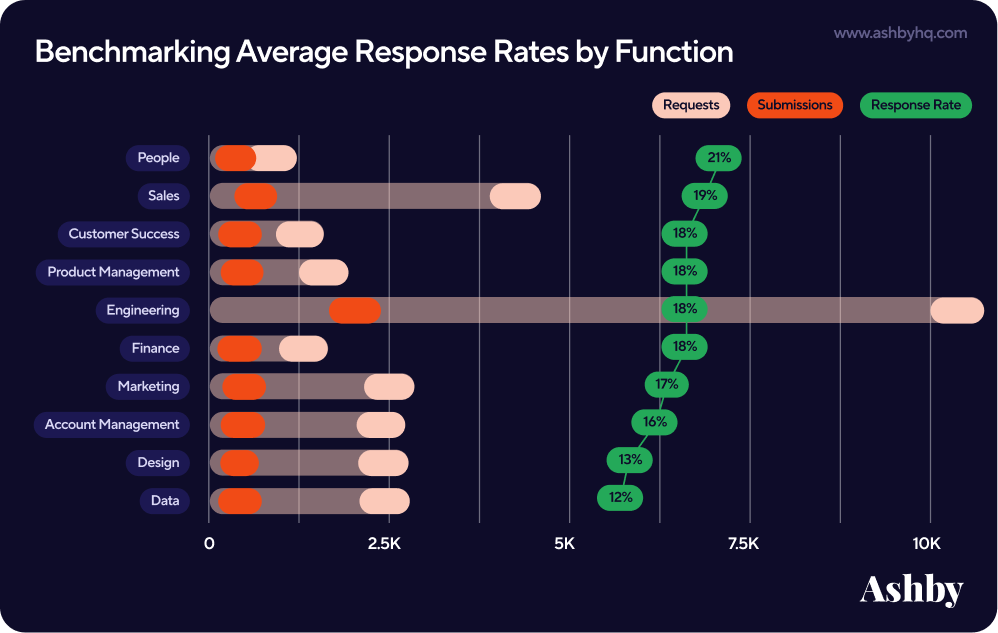
Insight 4: Benchmarking Average Response Rates by Function
Talent teams are no strangers to the nuances of a recruiting strategy based on what function or job category you are hiring for. That same level of personalization should apply to Candidate Experience Surveys.
In fact, top talent teams we’ve spoken with often set up surveys for different audiences or segment their survey data based on job function. In these cases, it can be more helpful to benchmark performance to response rates by department versus the overall average response rate across all groups.
3 Lessons from Notion’s High Candidate Response Rates
Notion is among the Ashby customers seeing remarkably strong response rates to their Candidate Experience Surveys. We had the pleasure of sitting down with Cuyler Hirata, Notion’s Head of Recruiting Operations & Analytics, for an inside look.
“One of Notion’s Operating Values is to be kind and direct. We encourage employees to give internal feedback that is both direct and thoughtful. Our recruiting team believes that being receptive to candidate feedback is no different. It’s core to our DNA and challenges us to craft a delightful and differentiated recruiting experience.”
— Cuyler Hirata, Head of Recruiting Operations & Analytics at Notion
Lesson 1: Intentionally customize your candidate experience survey questions.
Most companies recognize they should be collecting feedback, but Cuyler has seen how many companies are unable to make real changes based on the feedback they receive. He identifies the primary issue as the type of questions posed, which should inform the work of a recruiting team. Examples here include:
Regarding recruiters -
- Were the recruiters clear about the roles we’re hiring for?
- Did the recruiters follow up in a timely manner?
- How much insight did they provide into Notion’s values?
Regarding interviewer -
- Did your interview start and end on time?
- Did your interviewer seem prepared?
- Was your interviewer actively engaged throughout the call?
“A lot of what we ask in our surveys ties back to our specific recruiting expectations. We use responses to questions like these to take action on how we operate.”
— Cuyler Hirata, Head of Recruiting Operations & Analytics at Notion
P.S. We provide additional candidate experience survey questions including scale, multiple choice, and open-ended questions in this piece on designing your questionnaires.
Lesson 2: Add in Free Text Questions
While, of course, it’s important to have consistent data across your surveys, Cuyler believes a truly exceptional, positive candidate experience is born from the raw responses candidates provide in free text prompts. Examples include:
- Was there anything particularly notable about Notion’s process?
- How was it different from other companies you're interviewing with?
- If there was one thing you preferred we handled differently, what would it be?
“I honestly think free form questions are a bit more insightful than what you get from just a rating or point scale question. They are a special source of what makes us unique or what we should continue to lean into.”
— Cuyler Hirata, Head of Recruiting Operations & Analytics at Notion
Every month, Cuyler then takes these responses and shares them with recruiting leadership — and sometimes the broader company as well.
Lesson 3: Automate survey send at a 3-day delay.
Regarding the survey distribution, Cuyler’s team has set automatic triggers to ensure a 3-day delay after the candidate is archived or hired before the survey reaches them.
“Our mentality here is that, even if a candidate is rejected, we aim to personalize the rejection notes instead of merely sending an automated email. Delaying the survey by three days gives us time to communicate with candidates and not throw them off or hear about a potential rejection from a survey automation.”
— Cuyler Hirata, Head of Recruiting Operations & Analytics at Notion
Candidate Experience Surveys in Ashby
Ashby's native survey tool supports the ability to automatically send customizable candidate experience surveys to applicants at any stage of the hiring process. Recruiters can configure rules for how and when to collect them from candidates. You can then analyze the results of these surveys to make your recruitment process more effective by representing the voice of your candidates. Request a demo to learn more.
Candidate NPS Benchmarks
While traditional NPS data points to a score of 50 or above as excellent for company or product NPS, a great Candidate NPS score can look very different. A quick search online will reveal how limited the findings are for what makes a good, let alone great Candidate NPS.
Quick NPS Refresher
The Net Promoter Score (NPS) first came from Bain & Company in 2003 as a way to measure customer or employee loyalty. The traditional 1 to 10 scale question considers anyone who responds 0-6 as detractors, 7-8 as passives, and 9-10 as promoters. The standard NPS question is “How likely are you to recommend us on a scale from 0 to 10?”
NPS for Candidate Experience
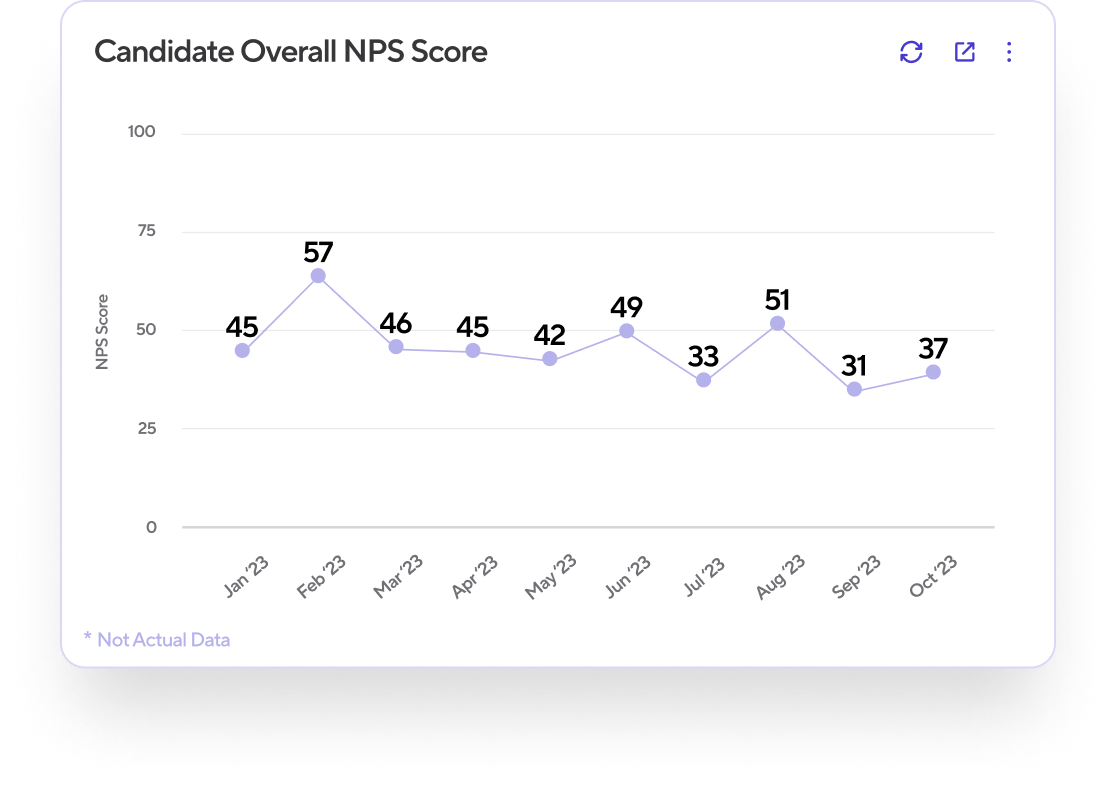
Digging into Ashby proprietary data, we found the average Candidate NPS to be 37 [Tweet This]. While we’ve heard a similar anecdotal average from talent leaders, little has been reported on what merits a “good” score in recruiting. Relently shares B2B NPS benchmarks where averages range from 39 to 67. A Qualtrics study of consumer NPS scores shows averages in a range of great variance, from -7.1 to 28.

At Ashby, we’re making a commitment to continue to track and understand Candidate NPS. We hope to report back on this metric, and for now will uncover some interesting insights we discovered so far.
“At M-KOPA we believe our recruiters and the colleagues in our interviewing process have a powerful role to play in our candidate journey. Our teams display one of our core values: Humility in service of our customers. This means we place our customers at the heart of what we do and collaborate without ego to deliver them.”
— Daniel King, Global Talent Acquisition Manager at M-KOPA
2 Initial Candidate NPS Findings
As we explored Candidate NPS, we also discovered intuitive findings to help validate some gut instincts you may have as a talent leader.
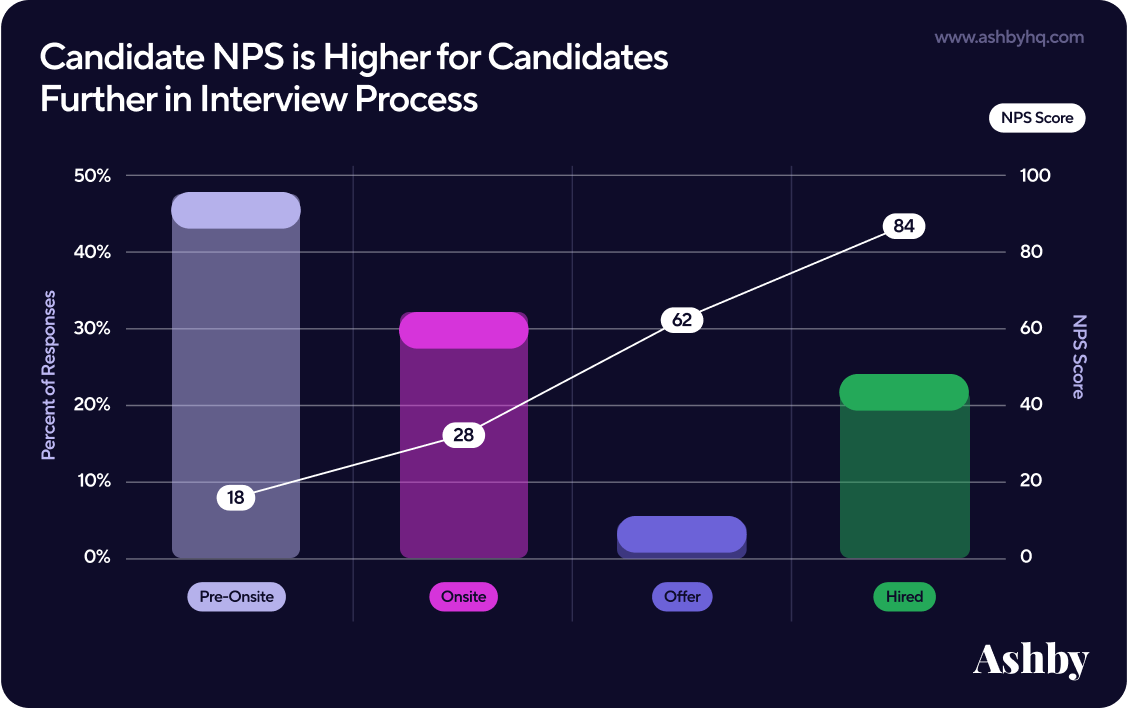
Finding 1: Candidate NPS is Highest for Hired Candidates
The candidate journey is important to keep in mind when analyzing Candidate NPS. Naturally, a score of 40, for example, should be interpreted differently for archived candidates than for hired candidates.
While we’ll dig into this further in the tips section shortly, this subtlety can better guide your hiring team's ability to improve. Turning to our Candidate NPS data, segmenting by hiring stages highlighted that:
- Active candidates that have gone through more than one interview stage yield an average 28 NPS. Given this is a high percentage of candidates overall, it’s likely it can skew the average score we touched on before.
- Candidates who receive the job offer yield an average NPS of 62. By standards of the Bain & Company NPS, this would be considered “excellent,” which would be a logically sound assumption at this stage in the hiring process.
- Hired candidates yield an average NPS of 85. Intuitively, this feels quite right as you’d expect those who take the job to respond with higher scores.
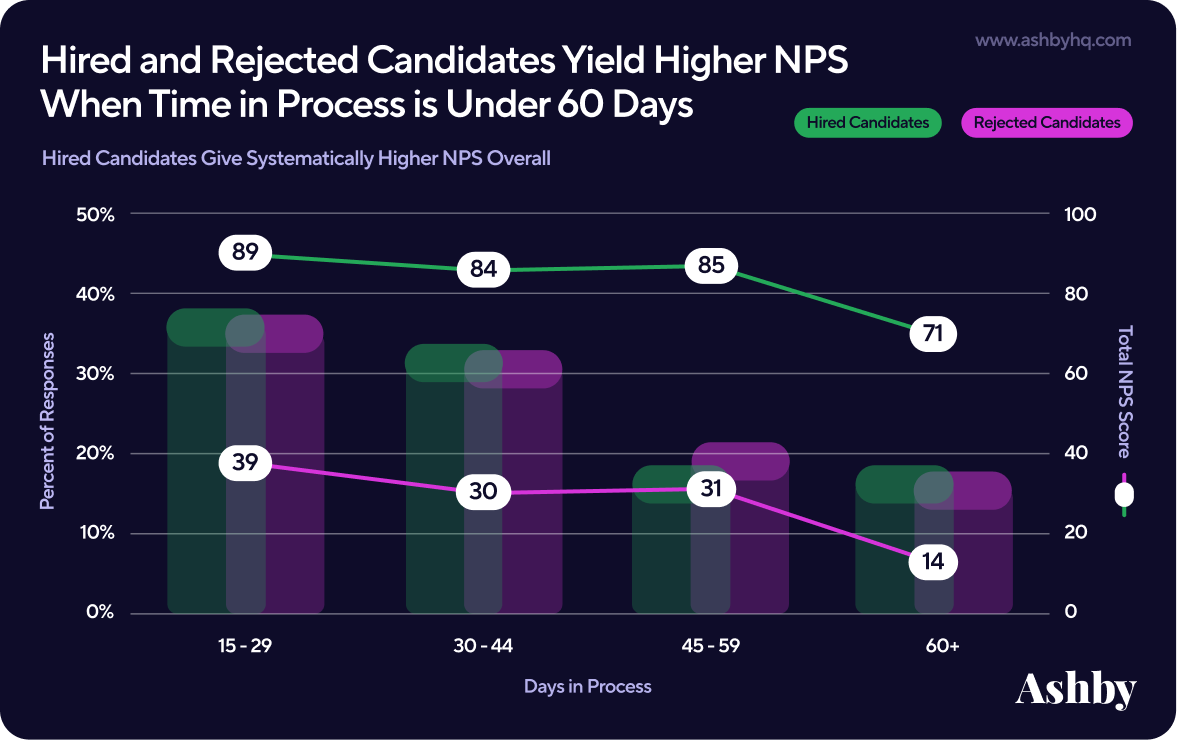
Finding 2: Hired and Rejected Candidates Yield Higher NPS When Time in Process is Under 60 Days
As seen in the chart below, candidates who spend anywhere from 15 to 59 days interviewing with a company result in minimal variance in scores — though hired candidates overall give systematically higher Candidate NPS. However, once a candidate is in the process for 60+ days, there’s a noticeable decline.
- For candidates who make it to an onsite interview before being rejected, we observed a 54.9% drop in NPS when in the process beyond 60 days.
- Even for those who ultimately got the job, we observed a 16.5% drop in NPS for hired candidates who stayed in the process beyond 60 days.
Looking at this data from a slightly different angle, we can also see that preventing candidates from being in the interview process for longer than required — such as archiving candidates when you’re ready to separate from them — can help yield overall stronger Candidate NPS scores. This stands true for both candidates who end up with the job and those who do not. One can imagine the score a company might receive from a candidate rejected after 61+ days in the hiring process.
5 Tips from Talent Teams with Strong Candidate NPS
To better understand how to meaningfully improve the experience of candidates, we spoke to some teams earning a Candidate NPS well above the 37 average. First, we’d like to congratulate the top three Ashby customers for truly impressive Candidate NPS scores!
Round of applause for M-KOPA, Gorgias, and Notion!
Let’s learn directly from these talent teams that candidates seem to love their experiences with. We spoke with:
- Mihaela Suilea, Recruiting Team Lead at Gorgias
- Cuyler Hirata, Head of Recruiting Operations & Analytics at Notion
- Daniel King, Global Talent Acquisition Manager at M-KOPA
Tip 1: Empower a recruiter to own candidate experience.
The Gorgias talent team dedicates 20% of each recruiter’s time to a new project, typically on a quarterly basis. One recruiter on the Gorgias talent team dedicated one of their 20% projects to owning not only Candidate NPS, but the overall Candidate Experience Survey. This included determining how many and which questions to ask.
Tip 2: Send Candidate Experience Surveys at various hiring stages.
During this 20% project, the recruiter also experimented with which stage of the interview process to send the survey. While having one survey for all applicants at all stages is a great start, breaking out candidates into cohorts by hiring stage can yield much stronger and actionable insight.
Turning to the names of the surveys in our Ashby dataset, we can see Ashby customers using our multiple survey functionality are often sending them at stages such as:
- Archived Candidates
- Candidate Withdrew
- Hired Candidates
- Rejected after at least 1 Interview
- Archived Post-Hiring Manager Screen
- Archived Post Stage 1
- Disqualified at Screen
- Disqualified at Onsite
- Post Offer Extension
- Mid-Process Survey
- Offer Sent
- Rejected Us After 1st Stage
- Rejected Us After 2nd Stage
- Rejected Us at Final Stage
- New Hire Survey
- Post-Onsite Survey
- Founder Call Stage
- Post Technical Screen
- Phone Screen Only
… the list goes on, but these help paint a picture of different points in the process to collect candidate experience feedback. Shout out to Ashby customers for the great inspiration on survey naming conventions here as well. 🙂
Tip 3: Dig into the factors driving change in your NPS.
Both Mihaela from Gorgias and Daniel from M-KOPA routinely check their Candidate NPS scores. When noticing a change from the usual — good or bad — their first reaction is to dig into the factors that drive NPS.
Using the Candidate Experience Dashboard their teams built in Ashby, they usually start their respective analysis by checking the overall Candidate NPS their teams are scoring every month.
To understand the symptoms behind any given month, both talent leaders shared various filters they’d drill into. Just a few examples we heard included…
- Department: This provides a view into how the Candidate NPS score may fluctuate function to function.
- Outcome: Given the massive changes in Candidate NPS scores we saw earlier from candidates who were rejected versus moved forward in the process, this can help explore differences between archived and hired groups.
- User aka Recruiter: This helps a talent leader quickly notice if a recruiter is performing exceptionally well or if there are some obvious areas for improvement.
Once they’ve drilled deep enough into the data (a process we call AAA Reporting in our Hiring Excellence Framework), they’ll then read the raw responses. Reading these responses within filtered groups allows the qualitative data to help tell a stronger story.
Tip 4: Foster a culture of constructive accountability.
As aforementioned, Mihaela and Daniel are able to monitor Candidate NPS by recruiter. This intel can be incredibly valuable in ramping up new employees on your talent team, sharing wins across the team, and knowing if things fall below the line. Rather than making assumptions about what may have happened, the quantitative (results) and qualitative (raw responses) can come together to inform how a situation played out.
“Gorgias is a very data-driven company; one of our values is to put our customers first. For me as the manager of the recruiting team, my customers are my candidates and hiring managers."
— Mihaela Suilea, Recruiting Team Lead at Gorgias
Tip 5: Determine the right time to send the survey.
While this differs among Ashby customers, Cuyler says all Notion Candidate Experience Surveys are sent after the onsite stage. The team believes this gives the candidate enough time to have an informed experience with Notion, whereas sending later in the process could lead to missing out on a good chunk of intelligence as the candidate pool narrows.
The team has considered doing pulse surveys before candidates reach the onsite stage, but are still tinkering with the right level of noise or volume of asks to put on a candidate.
Analyzing Candidate NPS
💡Tip for Ashby Customers: You can find a prebuilt report template called Candidate NPS Score. It displays the NPS Score according to the standard formula: % of promoters - % of detractors, giving a score from -100 to 100.
Conclusions
Through analyzing 67.4K surveys requests sent and 11.9K survey responses, we ultimately found:
- Most candidates respond to surveys within nine days.
- The design and structure of your surveys depend highly on your internal strategy, with some preference towards up to 10 question surveys without anonymous responses allowed.
- Candidate NPS is generally an under-analyzed metric, with Ashby committing to tracking and unveiling more data on this metric in the future to help talent teams build reliable benchmarks.
We hope these insights help Talent Teams navigate, evolve, and inform their strategy around candidate experience. For more, subscribe to our Talent Trends newsletter where we’ll share key findings and additional context to the recruiting metrics our team is tracking.
Other Reports

The State of Startup Hiring | 2026 Talent Trends Reports
Data from 1,200+ venture-backed startups on AI adoption, remote hiring, application volume, time to hire, and offer acceptance rates.

2023 Trends Report | Applications Per Job
Analyzing 13 million applications from January 2021 - April 2023 to surface key patterns around applications per job per week.

Subscribe for more talent trends and insights
We will be regularly releasing new reports around trends and insights we're seeing in our data and you will be the first to know.