2023 Trends Report | Applications Per Job

7 minute read
Analyzing 13 million applications from January 2021 - April 2023 to surface key patterns around applications per job per week. You can download the free PDF here.
Benchmarking applications per job
This report presents an analysis of the Applications per Job per Week (‘Applications per Job’) trend from January 2021 - April 2023, focusing on the inbound application rates. The primary goal of the analysis is to answer the question, "How many inbound applications should I expect to receive when I open a job?" The report also identifies suggestions for how to increase high quality inbound applications.
The data pulled in this report analyzed over 13 million applications of predominantly US-based tech companies with between 1 and 1,500 employees. When conducting the initial analysis, we broke the data down by company size but, surprisingly, did not find significant differences, thus the results presented here should represent a good starting point for your team. However, we did find that there were significant differences in sub-job-categories, so have broken this out at the conclusion of the report.
Please note that while these are valuable benchmarks they are no substitute for establishing your own internal baseline and tracking success and progress against that.
Key takeaways
We saw in our Offer Acceptance Rate report that more hires were being made from direct applicants over recent quarters, which motivated a closer look at inbound applications. While unsurprising given the macroeconomic environment, our findings confirmed consistent trends in inbound applications overall. Key takeaways included:
-
Application rates per week have increased by 3X from January 2021 - April 2023, across business and tech roles.
-
The strongest peak occurs in the first week of job postings followed by a steady state of heightened application rates.
-
The average number of applications in the first four weeks can serve as a proxy for answering the question of how many inbound applications you will receive in following weeks/months.
-
These benchmarks raise important considerations for TA teams as they build strategies for managing increased inbound applications. This report summarizes some of the most common approaches including automated application thresholds/blocking functionality, auto-reject capabilities, advanced filtering capabilities, and strategies for managing large application review realities.
When defining Application per Job we consider all direct applications made through the company website and job boards – this data does not consider referrals, sourced candidates, and other categories of application sources.
Application rates per job / per week have increased by ~3x
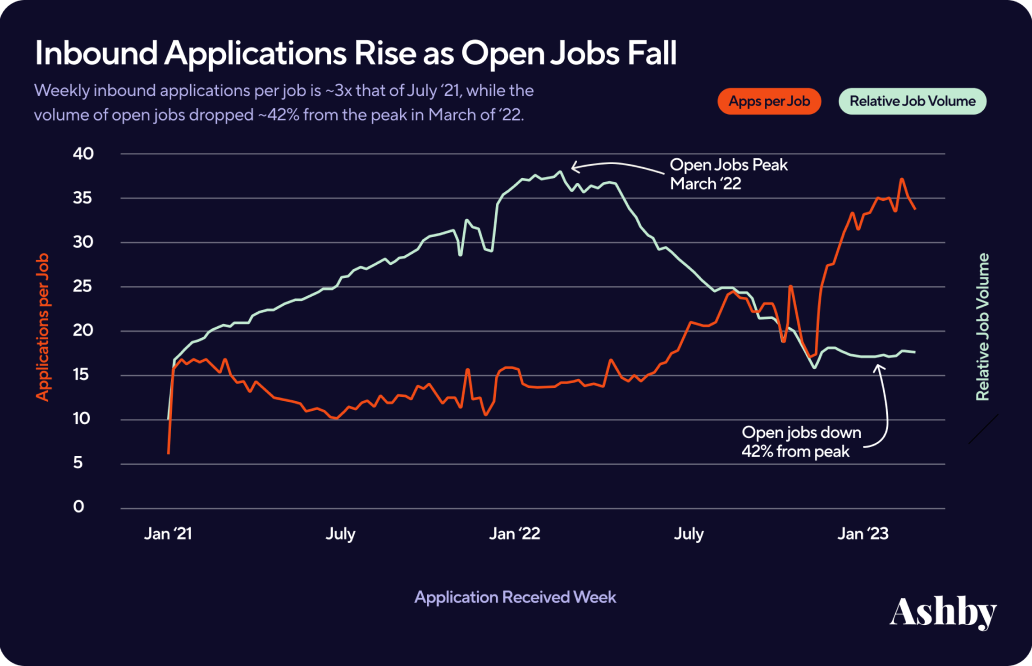
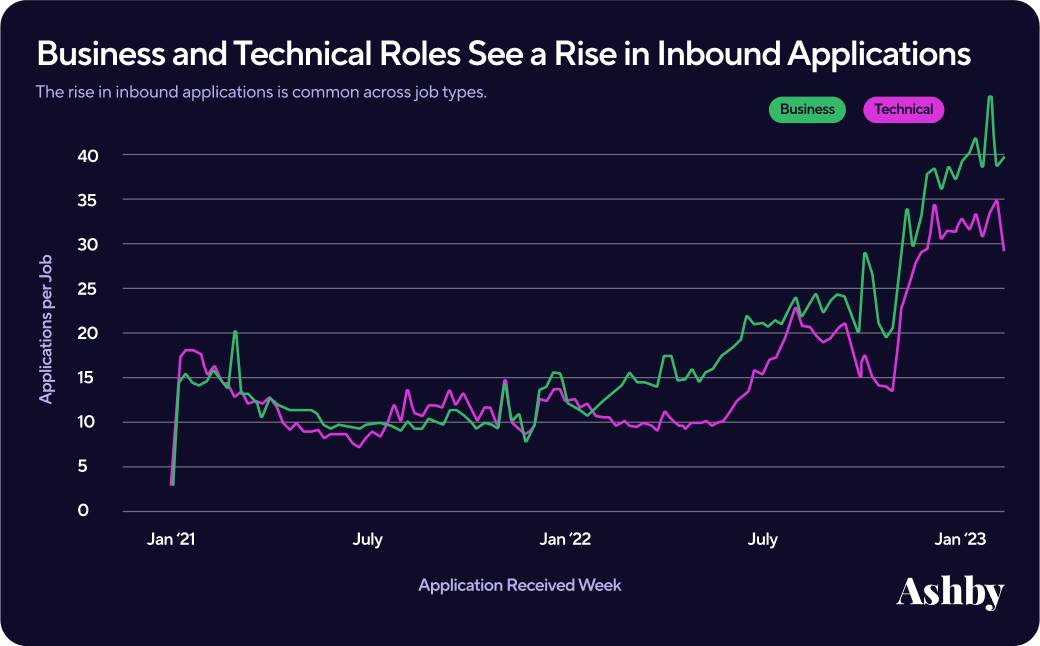
The analysis shows that the weekly application rate per job has significantly increased from January 2021 - April 2023, across both business and tech roles. Business roles experienced an earlier uptick in applications in 2022 than tech roles. We believe that this is likely because business roles represented a larger portion of the 2022 layoffs (43.9%) vs. tech roles which represented 22.1%. In 2023 according to LinkedIn reports there has been a slight climb in layoffs impacting tech roles more materially.
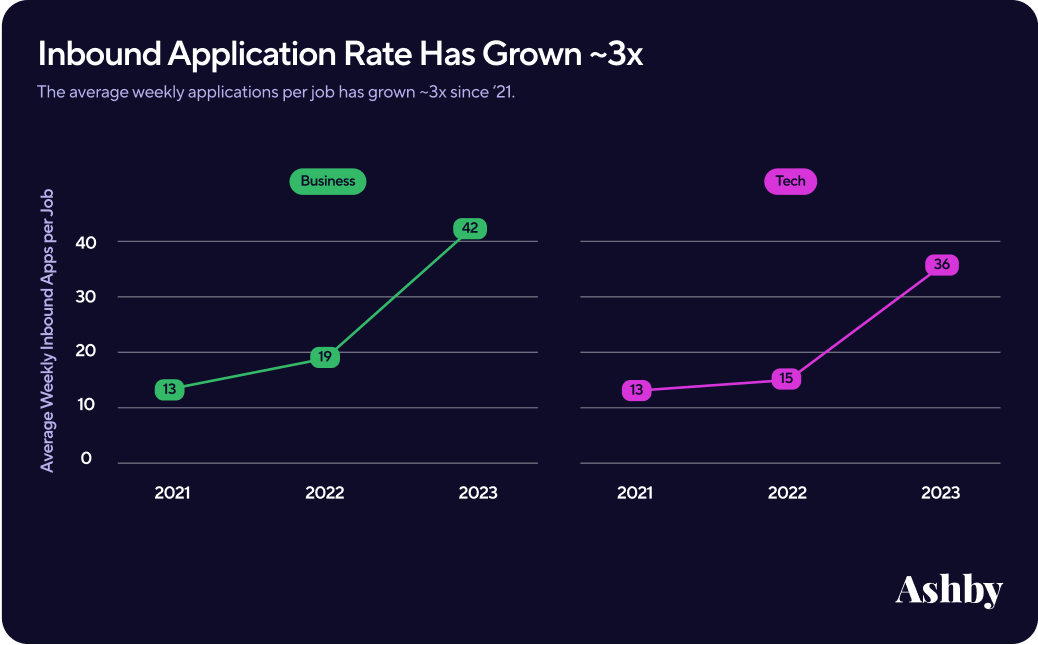
A cleaner look at the average weekly inbound applications per job confirms this trend.
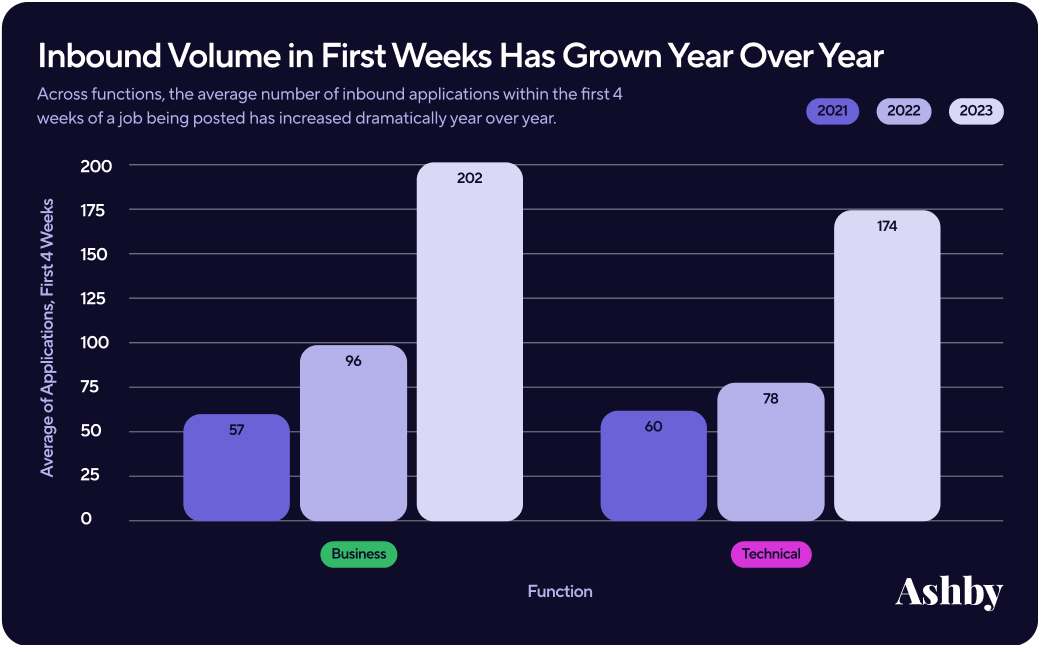
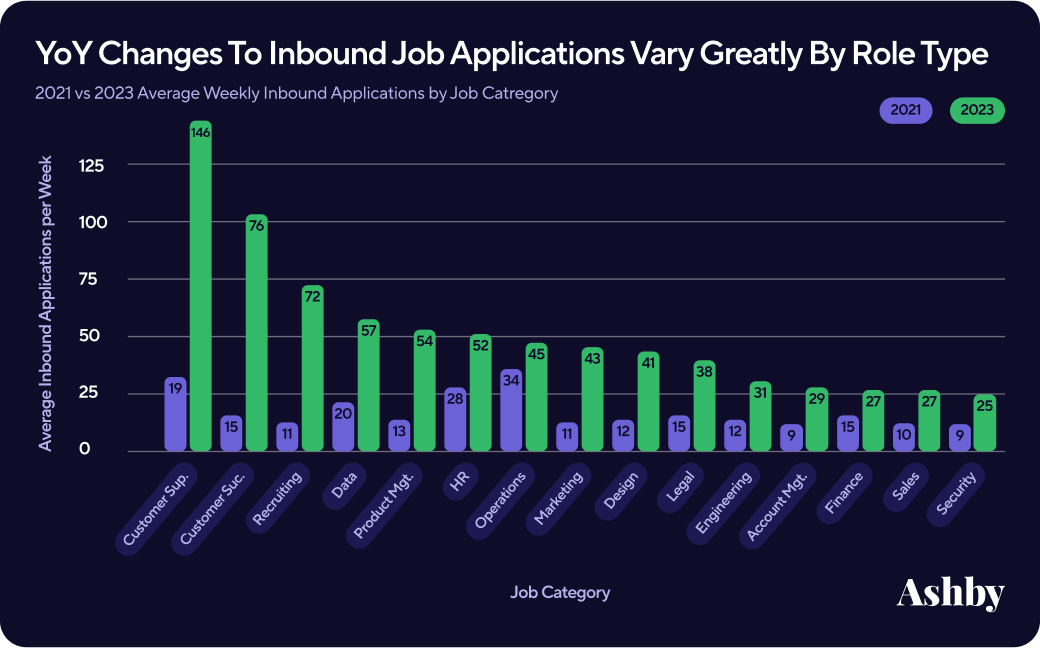
Another way to visualize this data is as a bar chart which highlights the dramatic YoY shift in inbound applications per job. Though the job market is a complex system, we believe the increased volume is a result of two factors: 1) the reduction in total roles currently available, and 2) the 150,000 people in the US in tech impacted by layoffs in 2022.
How to manage increased job application volume
While there are many benefits to increased inbound volume it does present new challenges for TA teams that are often resource constrained. To help manage this we recommend the following:
Start with the job posting
Create a strong initial job posting that highlights the unique benefits and opportunities of the position to attract quality candidates. Be specific on criteria and expectations for the role.
Set up a timeline
Establish a clear timeline for listing jobs as “open” to ensure there is recruiter capacity to review the applications. Do this by creating a priority ranking for roles and scheduling listing dates based on historical times to fill for similar roles.
Establish thresholds
Use the average number of applications from the second - fourth weeks as a proxy for answering the question of how many inbound applications to expect going forward. *Keep in mind that the first week is consistently 2-2.5x higher than following weeks. Utilize automated application thresholds/blocking functionality and auto-reject capabilities to manage large application review realities.
Rely on filters
Develop advanced filtering capabilities to quickly identify high-quality candidates and reduce time-to-hire.
Create question checkpoints
Add relevant questions to applications to support filtering. It is important that this question will aid with filtering against the skills you will be evaluating.
Social media can be a support
Leverage social media and other channels to increase visibility and attract a wider pool of potential candidates. Sharing the role with source locations that have yielded high quality of hire candidates in the past is also very helpful.
Track results
Continuously track and analyze inbound application rates to establish your own internal baseline and track progress against that.
*Ashby’s All-in-One solution supports all of these actions.
When considering the implications of this data it’s critical that your initial job posting for a role is as strong as possible. We suggest reviewing the following resources to assist with this:
-
Career Pages | Building Your Employer Brand to Attract the Right Candidates
-
Salary Transparency | Practical Tips for Compliance and Recruitment Marketing
The first week of inbound applications is consistently 2.5-3x higher than all following weeks
Inbound application rates consistently show a strong peak in the first week of 2.5-3x, followed by a sharp decline and, finally, a steady state.
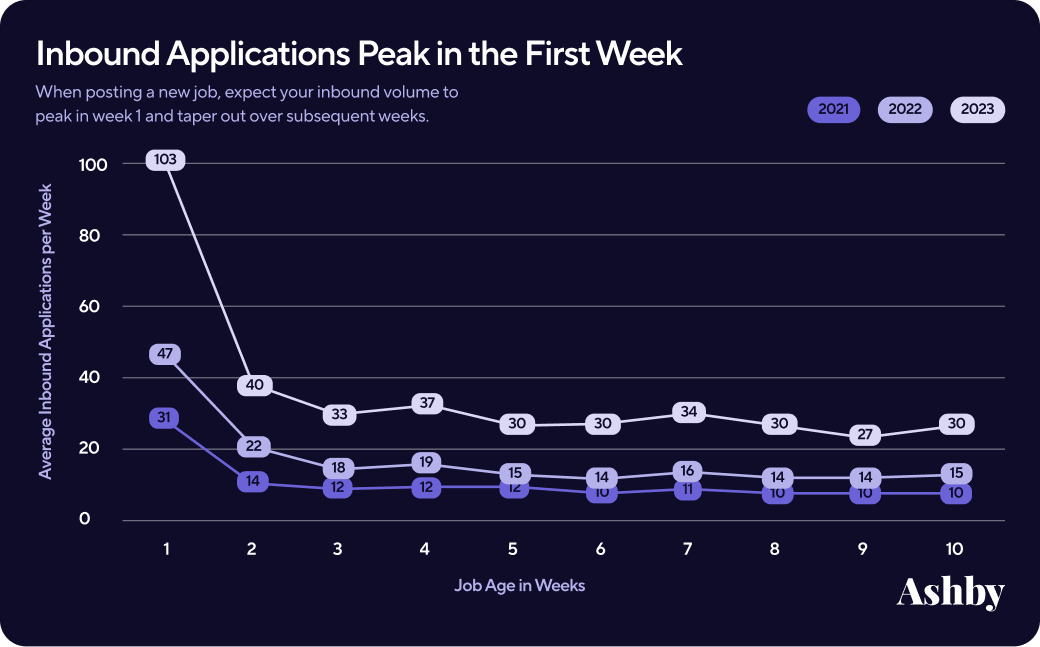
Business roles: Customer Success, Customer Support, Finance, HR, Legal, Security, Marketing, Operations, Recruiting, Sales, Account Management Tech roles: Engineering, Design, Data, Product Management
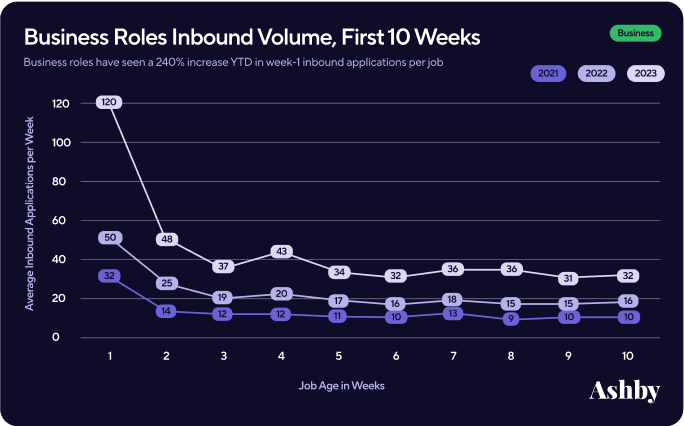
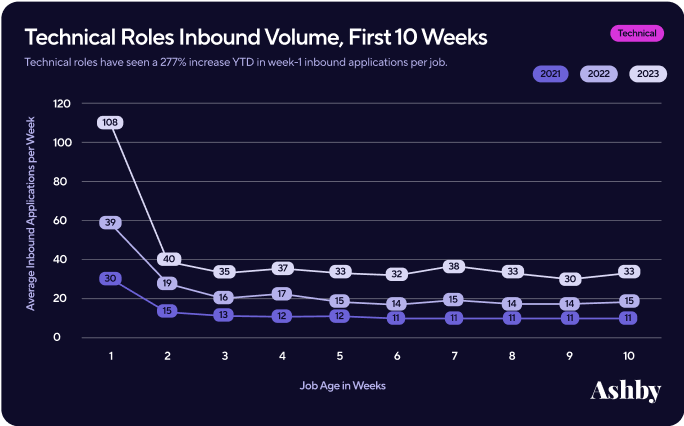
The same pattern holds across job categories by year.
When trying to understand why there is such a sharp spike in demand for a role in the first week we considered:
Visibility Job postings typically receive the most visibility in their first week when they are at the top of job boards or search results. This increased visibility can drive more traffic to the company's job board.
Limited application window Some job postings may have a limited application window, such as one week or two weeks. This can create a sense of urgency among job seekers and lead to a higher number of applications in the first week.
Novelty When a job is first posted, it is a new and exciting opportunity for job seekers, and there may be a rush of applications in the first week as people are eager to apply. However, as time goes on, the job posting becomes less novel and job seekers may not be as motivated to apply.
Early bird advantage Some job seekers may believe that, by applying early, they have a better chance of being considered for the job. This can lead to a rush of applications in the first week, as job seekers try to get their application in before the deadline.
We did not see much variation in application per job rates by company size but saw a stark difference by role type
Looking at the inbound application rates by specific job categories also uncovered some dramatic changes over the last few years. Below we see the 2021 and 2023 average inbound application rates by job category. For example, we can see that Support, Success, and Recruiting roles stand out as having had significant increases in application volume.
Wrap up
As we gather more data on hiring in 2023, we look forward to analyzing if these trends stay consistent, and what surprises become norms. Things we will be watching in 2023:
- Time to offer
- Time to hire, and the candidate experience
- Interviews per hire
- Passthrough rates by role category
- Qualified candidate trends
- DEI pass through rates by stage
- Recruiter productivity trends ... and other benchmarks you want us to analyze
If you would like to receive more of these reports please subscribe below.
Subscribe to our Community and Event Updates
Join our community of recruiting teams at fast growing companies.