Recruiter Productivity | 2026 Talent Trends Report

Ben is a Data Analyst at Ashby
12 minute read
Topics
Table Of Contents
Each year, we publish a set of recruiter productivity metrics to track how recruiting teams are operating. By monitoring these benchmarks year after year, we can distinguish structural shifts in hiring efficiency from temporary market noise. Our goal is to help talent teams develop a data-driven perspective on their evolving recruitment strategy.
This report analyzes over 109M applications and 247K jobs from January 2021 through March 2026. Subscribe to our Talent Trends newsletter to receive a PDF copy and bite-sized insights in your inbox every week.
Report Highlights:
The primary trends in this latest analysis include:
- High-Volume Baseline: Applications per Hire tripled from 2021 to 2024 and remained above 300 throughout 2025. Even as volume begins to moderate, this remains a clear signal of how much top-of-funnel volume has shifted.
- Recruiter Resilience: Despite the volume surge, Hires per Recruiter have recovered from 2023 lows, with the average recruiter reaching ~7 hires per quarter.
- Stronger Conversion Rates: Candidates who reach the interview stage are converting to offers at rates that surpass the 2021 levels. Teams are interviewing fewer candidates as a fraction of all applications, and candidates who receive an interview are more likely to be the right fit.
- The Interview Intensity Gap: Technical hiring remains significantly more resource-intensive, averaging nearly twice the interview hours and one additional interview event compared to business roles.
- Stabilized Timelines: Time to First Fill has settled at 8 weeks for business roles and 10 weeks for technical roles, suggesting a return to predictable hiring cycles.
A note on methodology: Some figures may differ slightly from prior analyses, reflecting the addition of new historical data. Where differences are meaningful, we've noted them.
Let's dig in.
Part 1: The Recruiter Experience
Recruiting has always been about doing more with less. But over the past five years, the volume of work sitting at the top of the funnel has pushed this to all new levels. We looked at both average Hires per Recruiter and Applications per Hire to understand how the recruiter workload has shifted.
Let's start with Applications per Hire (purple bars on the chart below).
Application volumes remain elevated
- Applications per Hire tripled from 2021 to 2024 and remain elevated today.
- Throughout 2025, every hire required more than 300 applications on average.
- The average recruiter today is processing 291 applications per hire, compared to roughly 100 in early 2021.
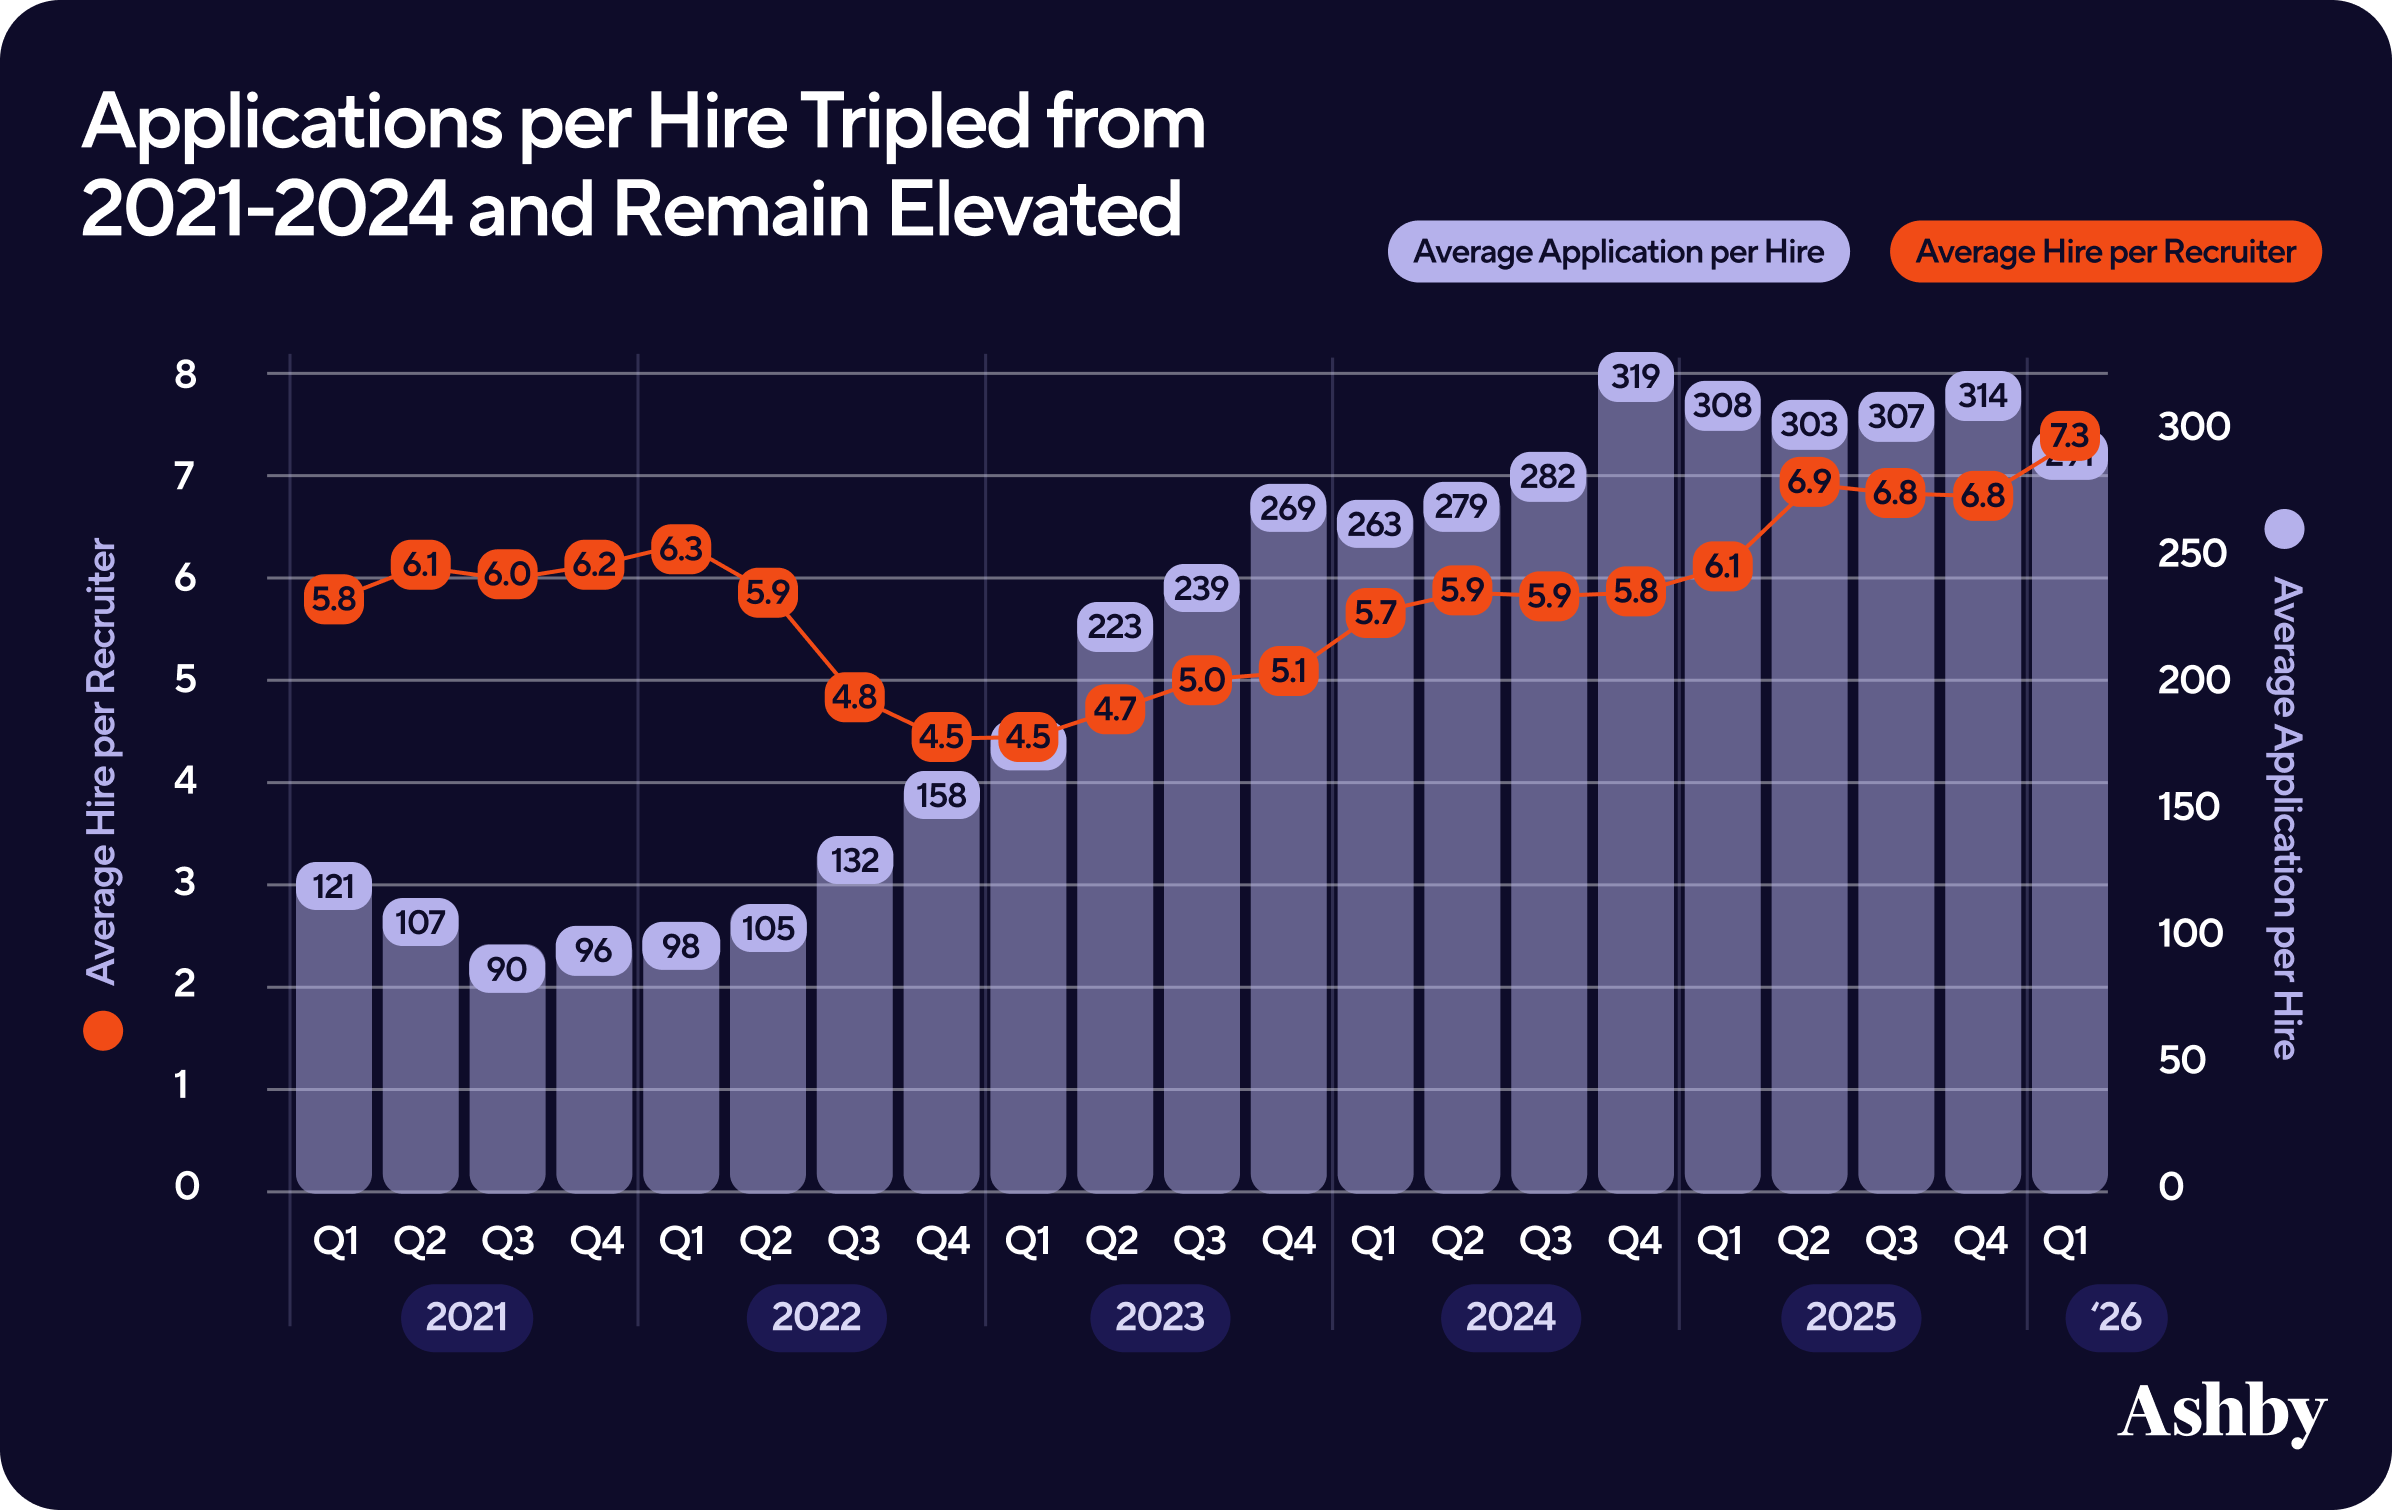
The red line on this same chart represent Hires per Recruiter.
Hires per Recruiter has rebounded
- In 2022, application volume increased while Hires per Recruiter moved in a different direction, seeing a decline(red line).
- After bottoming out at 4.5 hires per quarter in early 2023, the average recruiter reached 7.3 hires per quarter by Q1 2026.
- By 2023, the relationship reversed, and both Applications per Hire and Hires per Recruiter have increased together.
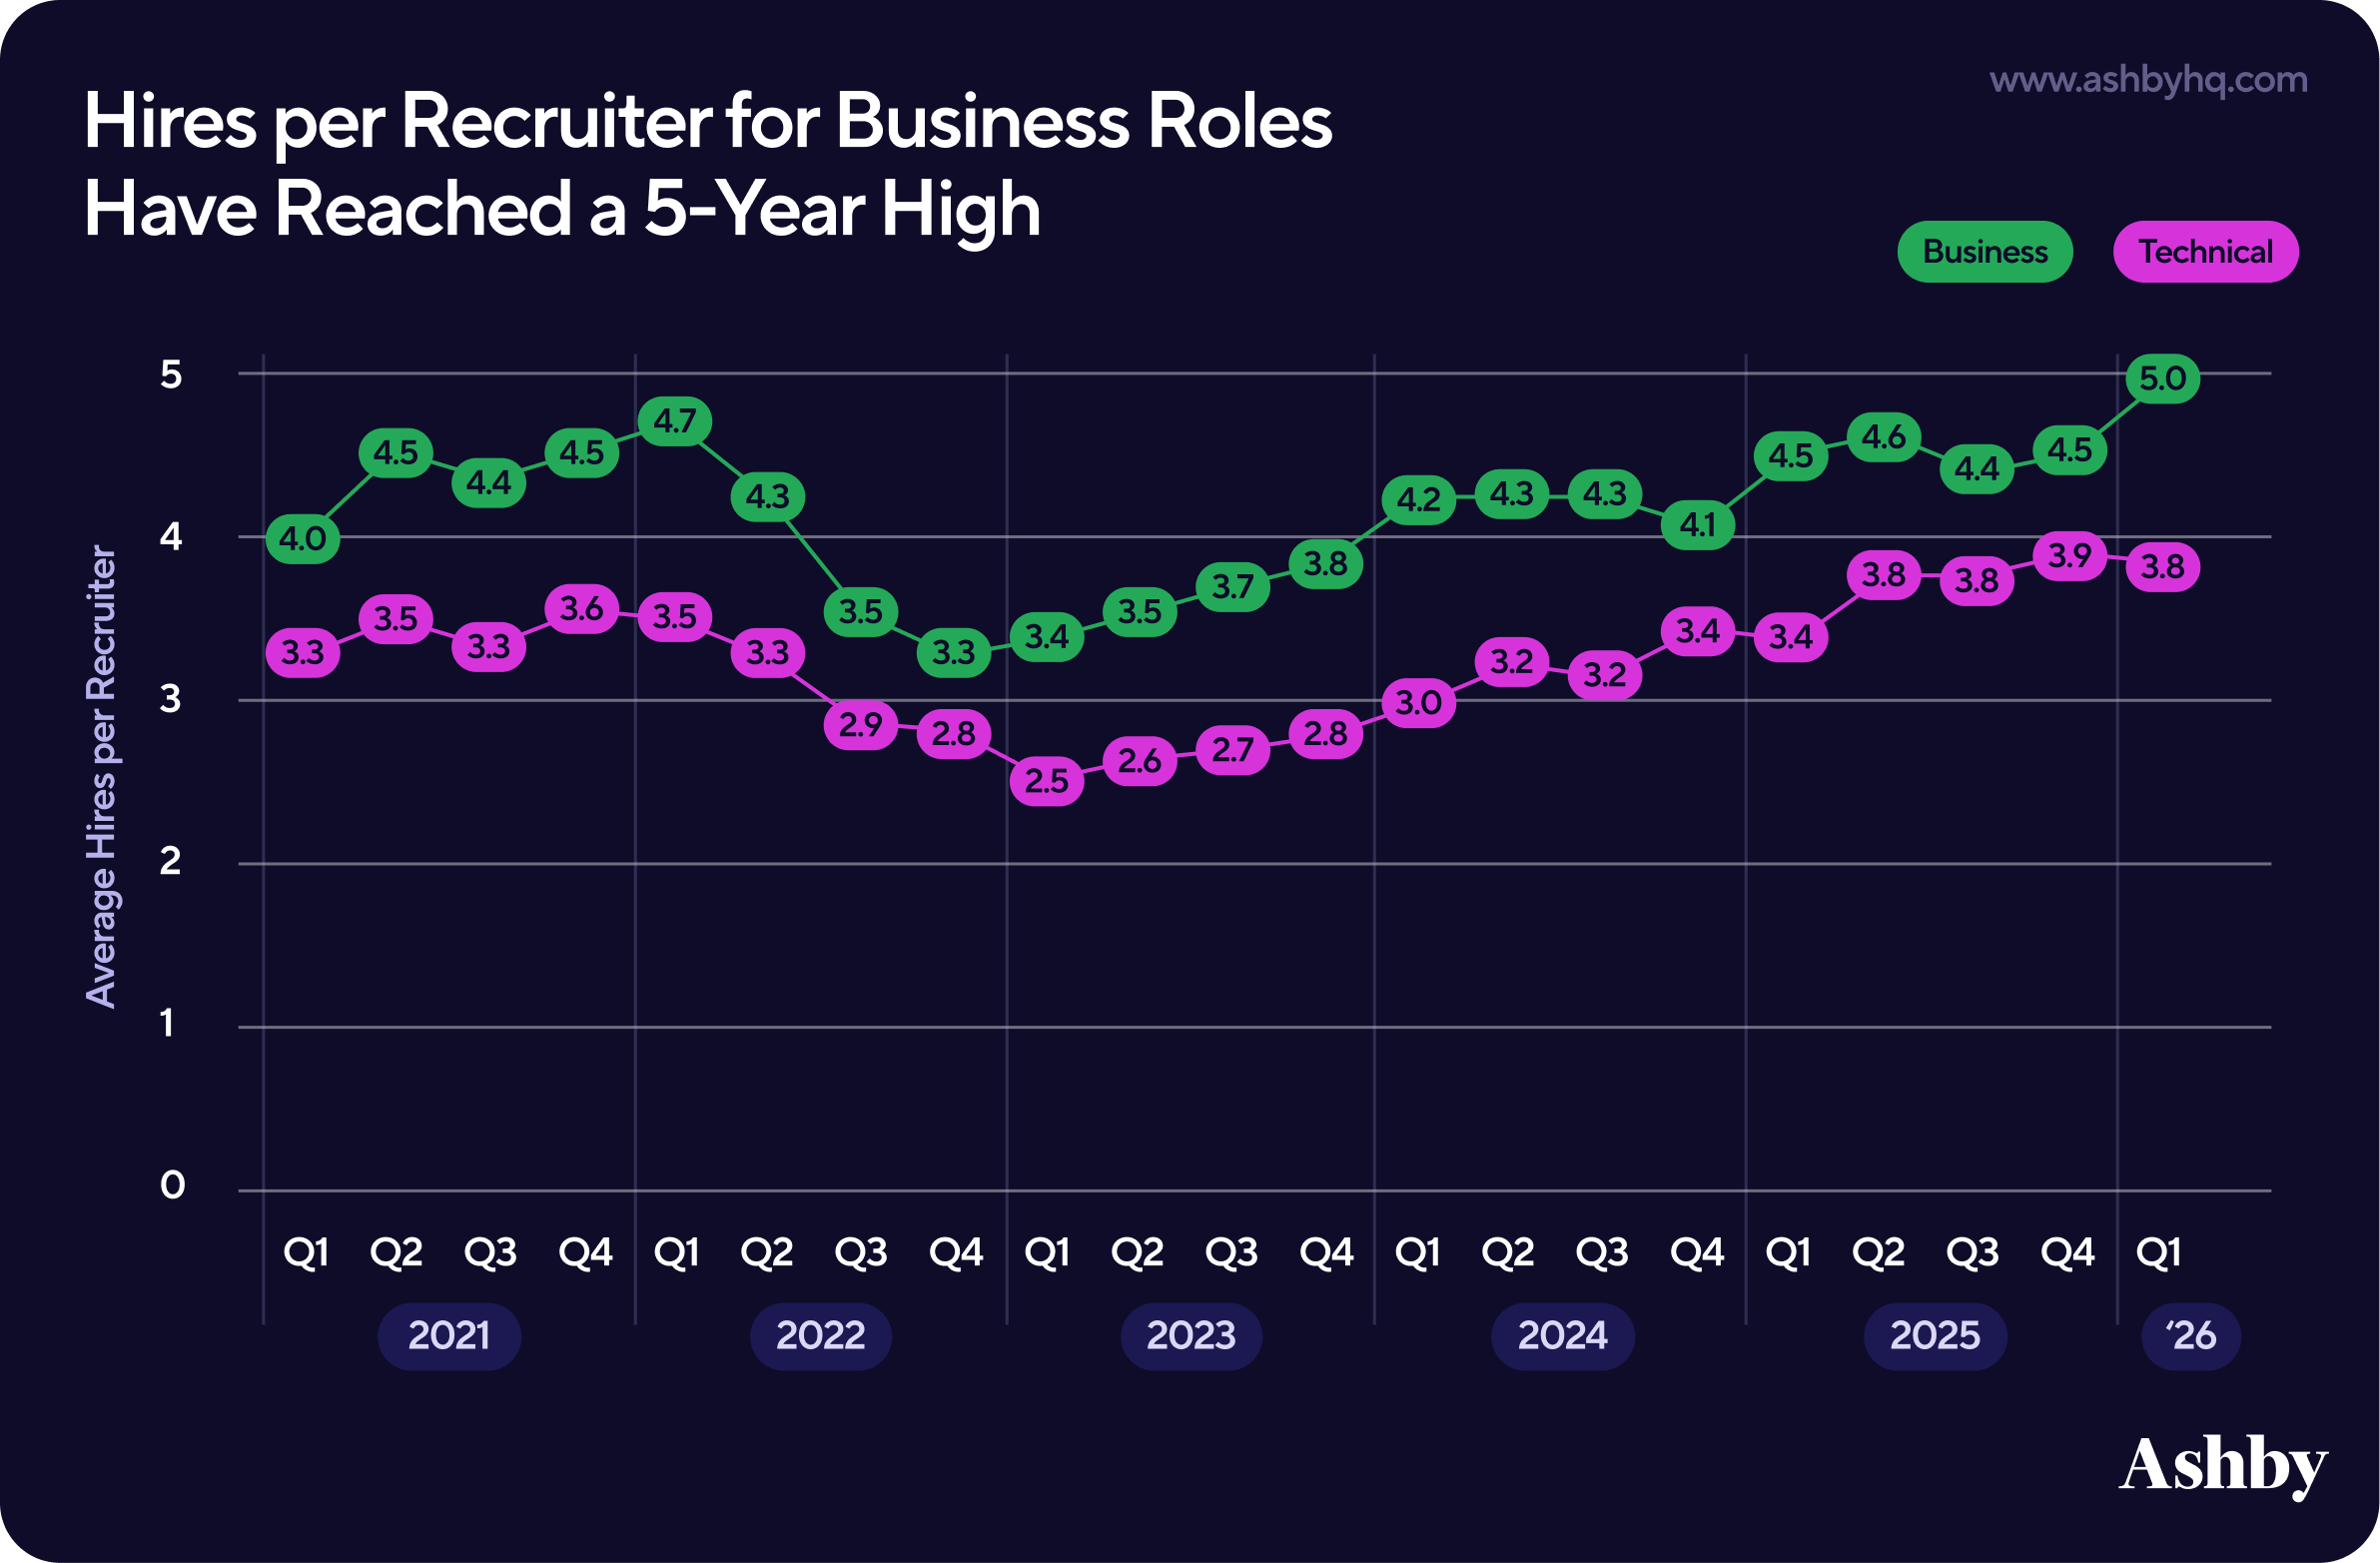
This rebound varied by Role Type
- Business recruiting led the rebound, increasing from a low of 3.3 hires per quarter in late 2022 to 4.3 by early 2024. During the time business hiring rose 1 hire per recruiter, technical hiring rose just 0.4.
- By Q4 2024, the gap between these two functions reached a multi-year low with business recruiters averaging 4.1 hires per quarter, compared to 3.4 for technical recruiters.
- By Q1 2026, business hiring has continued to climb, reaching a 5-year high of 5 hires per recruiter. Technical roles, while remaining at elevated levels compared to prior years, have stabilized at 3.8.
Overall, despite higher application volume, recruiters are hiring more per quarter. Anecdotally, layoffs impacted the size of talent teams, leaving fewer recruiters to manage the same volume of work. That makes the rebound even more notable, suggesting that recruiting teams have not only kept pace with increased inbound demand, they have regained hiring momentum. But what changed?
In our Applications per Job Report, we noticed a 2.6-3x growth in job applications at the start of 2024. Conversations with talent teams throughout the year indicated that managing inbound volume was a top challenge, and it led to the emergence of new technology to support, including Ashby’s AI-Assisted Application Review. Talent teams are leaning on this feature to save time and manage high volumes.
“All the automations, from sending notifications to candidates and interviewers to collecting feedback, used to be manual. Now it’s’ a click of a button. It just takes a little time to set up on the front end, and then it works for you. Features like AI-Assisted Application Review have been a huge time saver. The scheduling automation alone was a game-changer. We use candidate availability links, direct booking, and automated notifications daily. It allows our small team to manage high volumes without burning out. We can be lean because we have these capabilities.”
Melissa Potter, Director, Talent Acquisition,
NETGEAR
Now, let's take a look at interview intensity.
Part 2: Interview Intensity
More Applications per Hire means there are more candidates to evaluate, but volume at the top of the funnel is only part of the story. Interview intensity looks at how deeply teams are investing in each hiring decision and based on the trends we are seeing, that investment has grown.
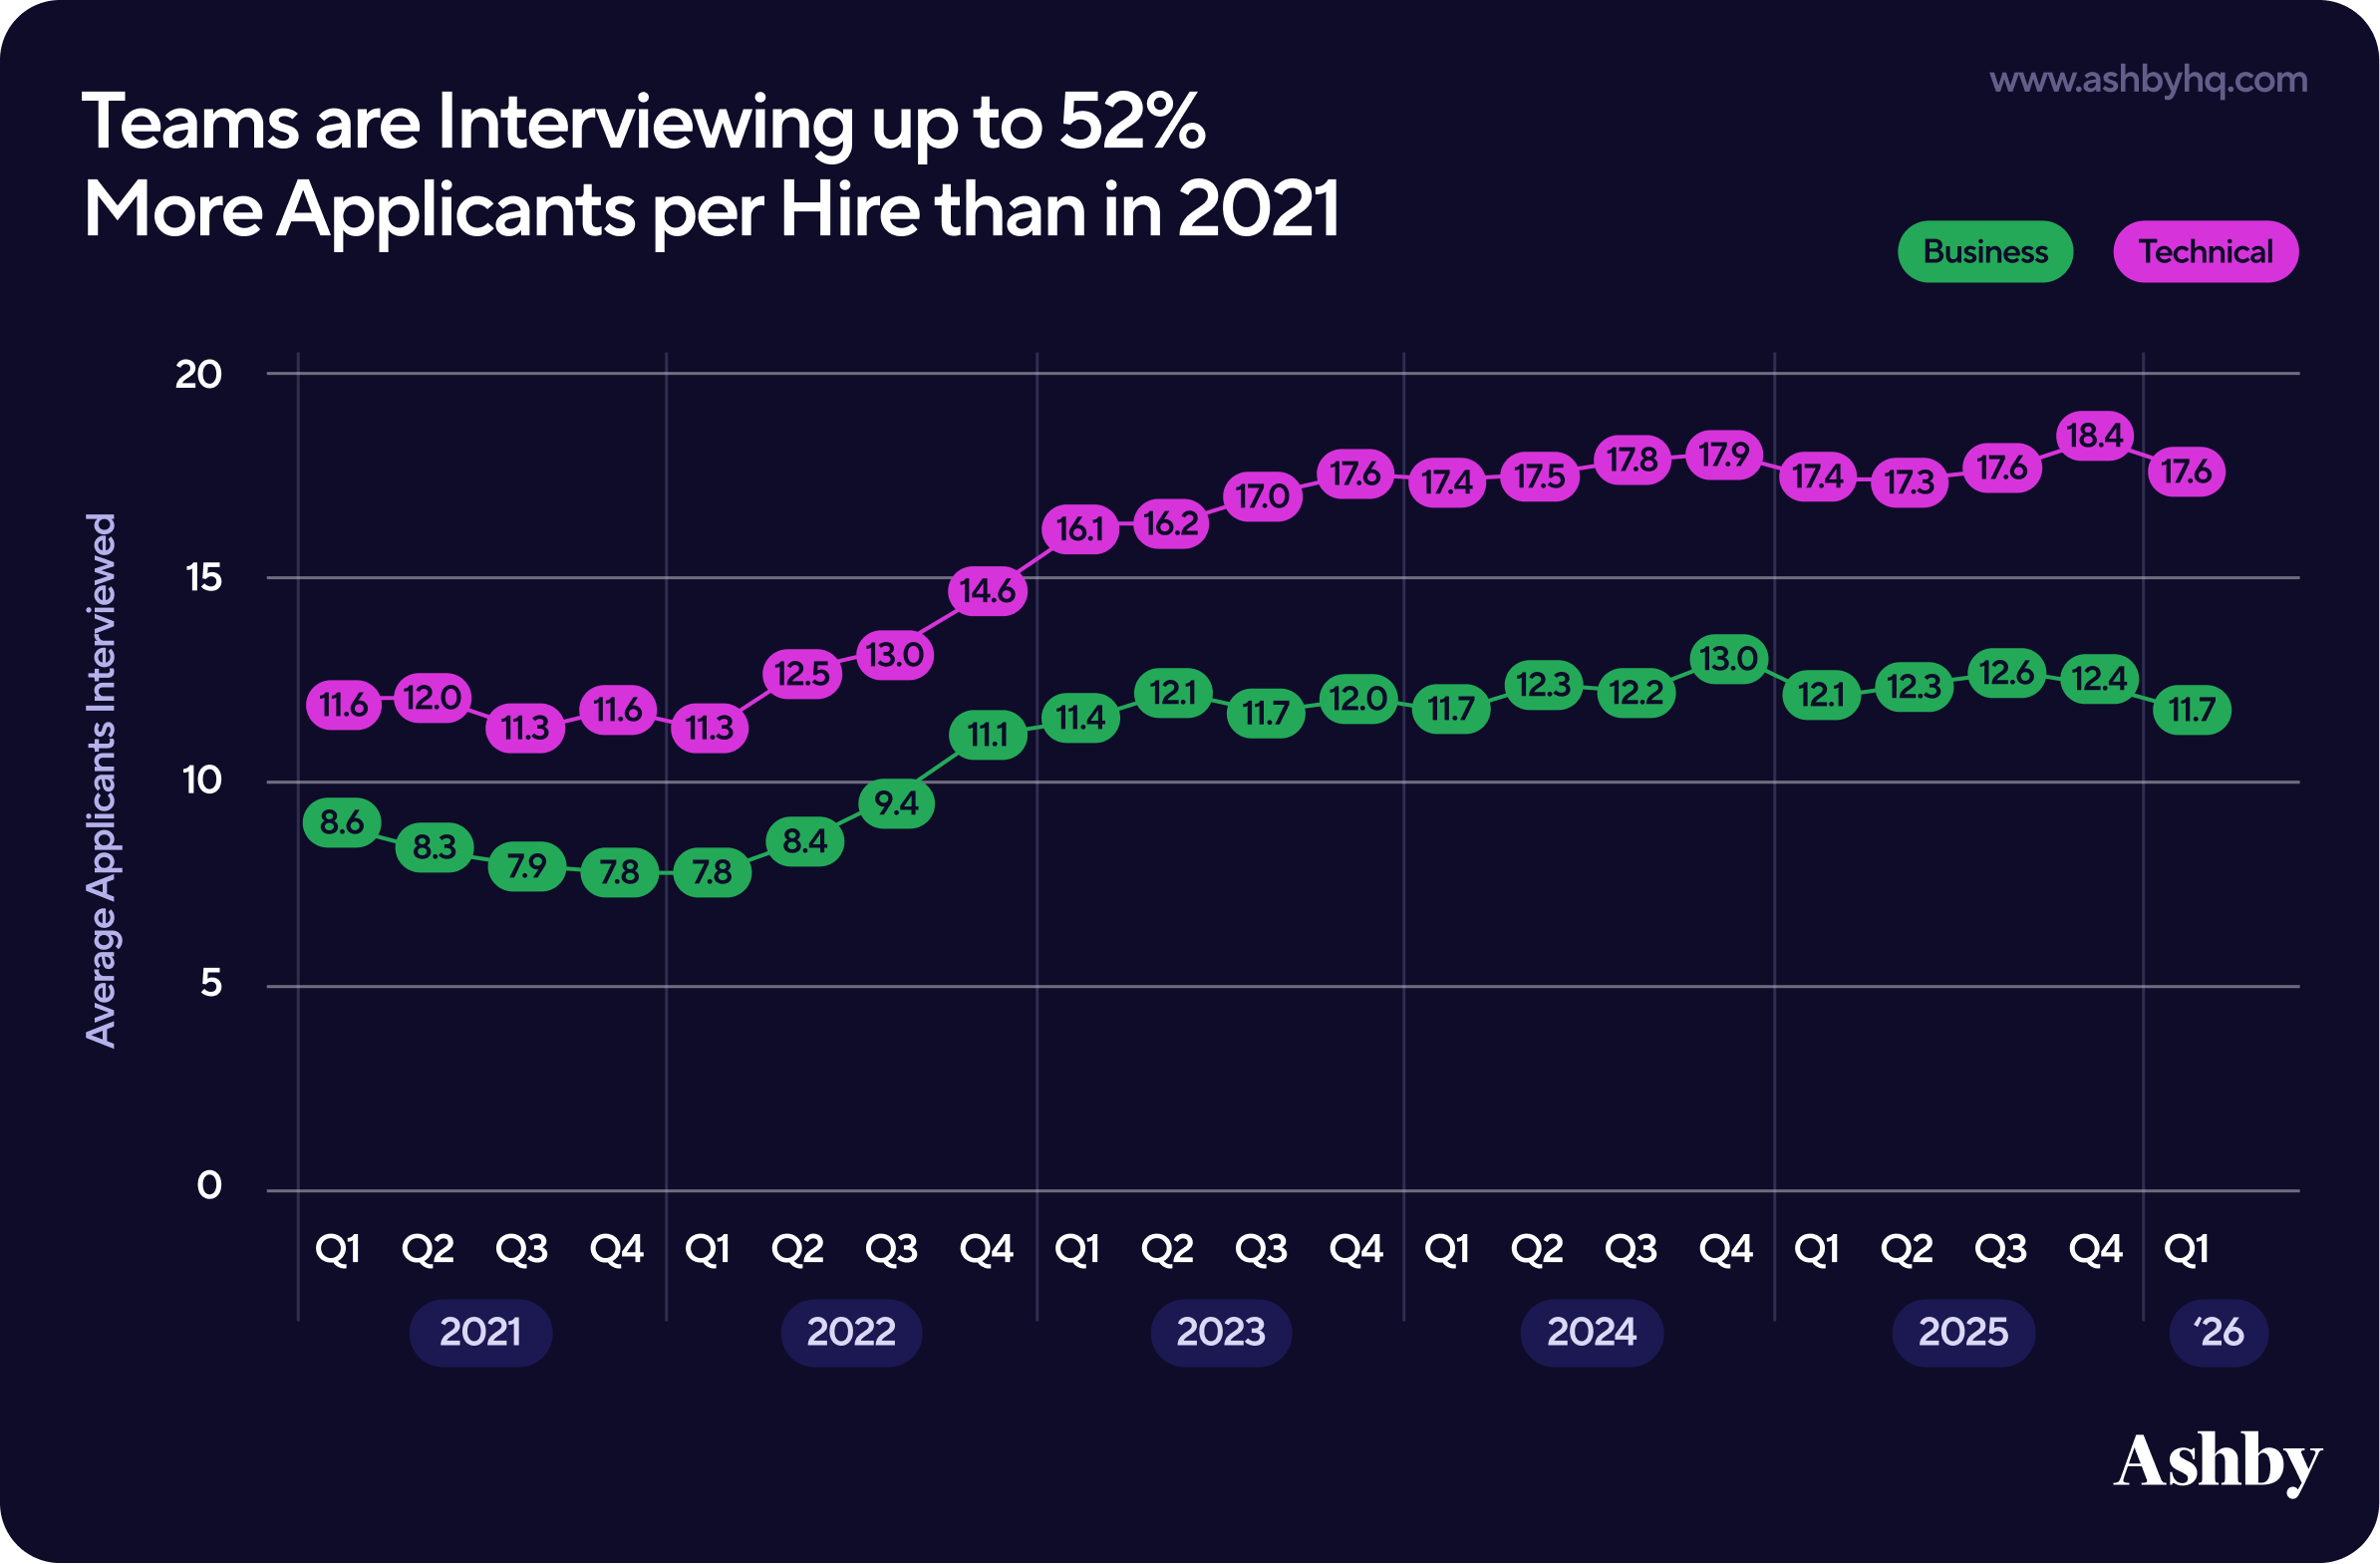
Teams are interviewing 52% more applicants
Hiring Teams are hosting more interviews per hire than in 2021, with technical roles being twice as “expensive” in terms of team hours compared to business hiring.
- Business roles are averaging 11.7 interviews per hire, a 36% increase from 2021 (~8 interviews per hire).
- Technical roles require more, averaging 17.6 interviews per hire, a 52% increase from 2021 (~11 interviews per hire).
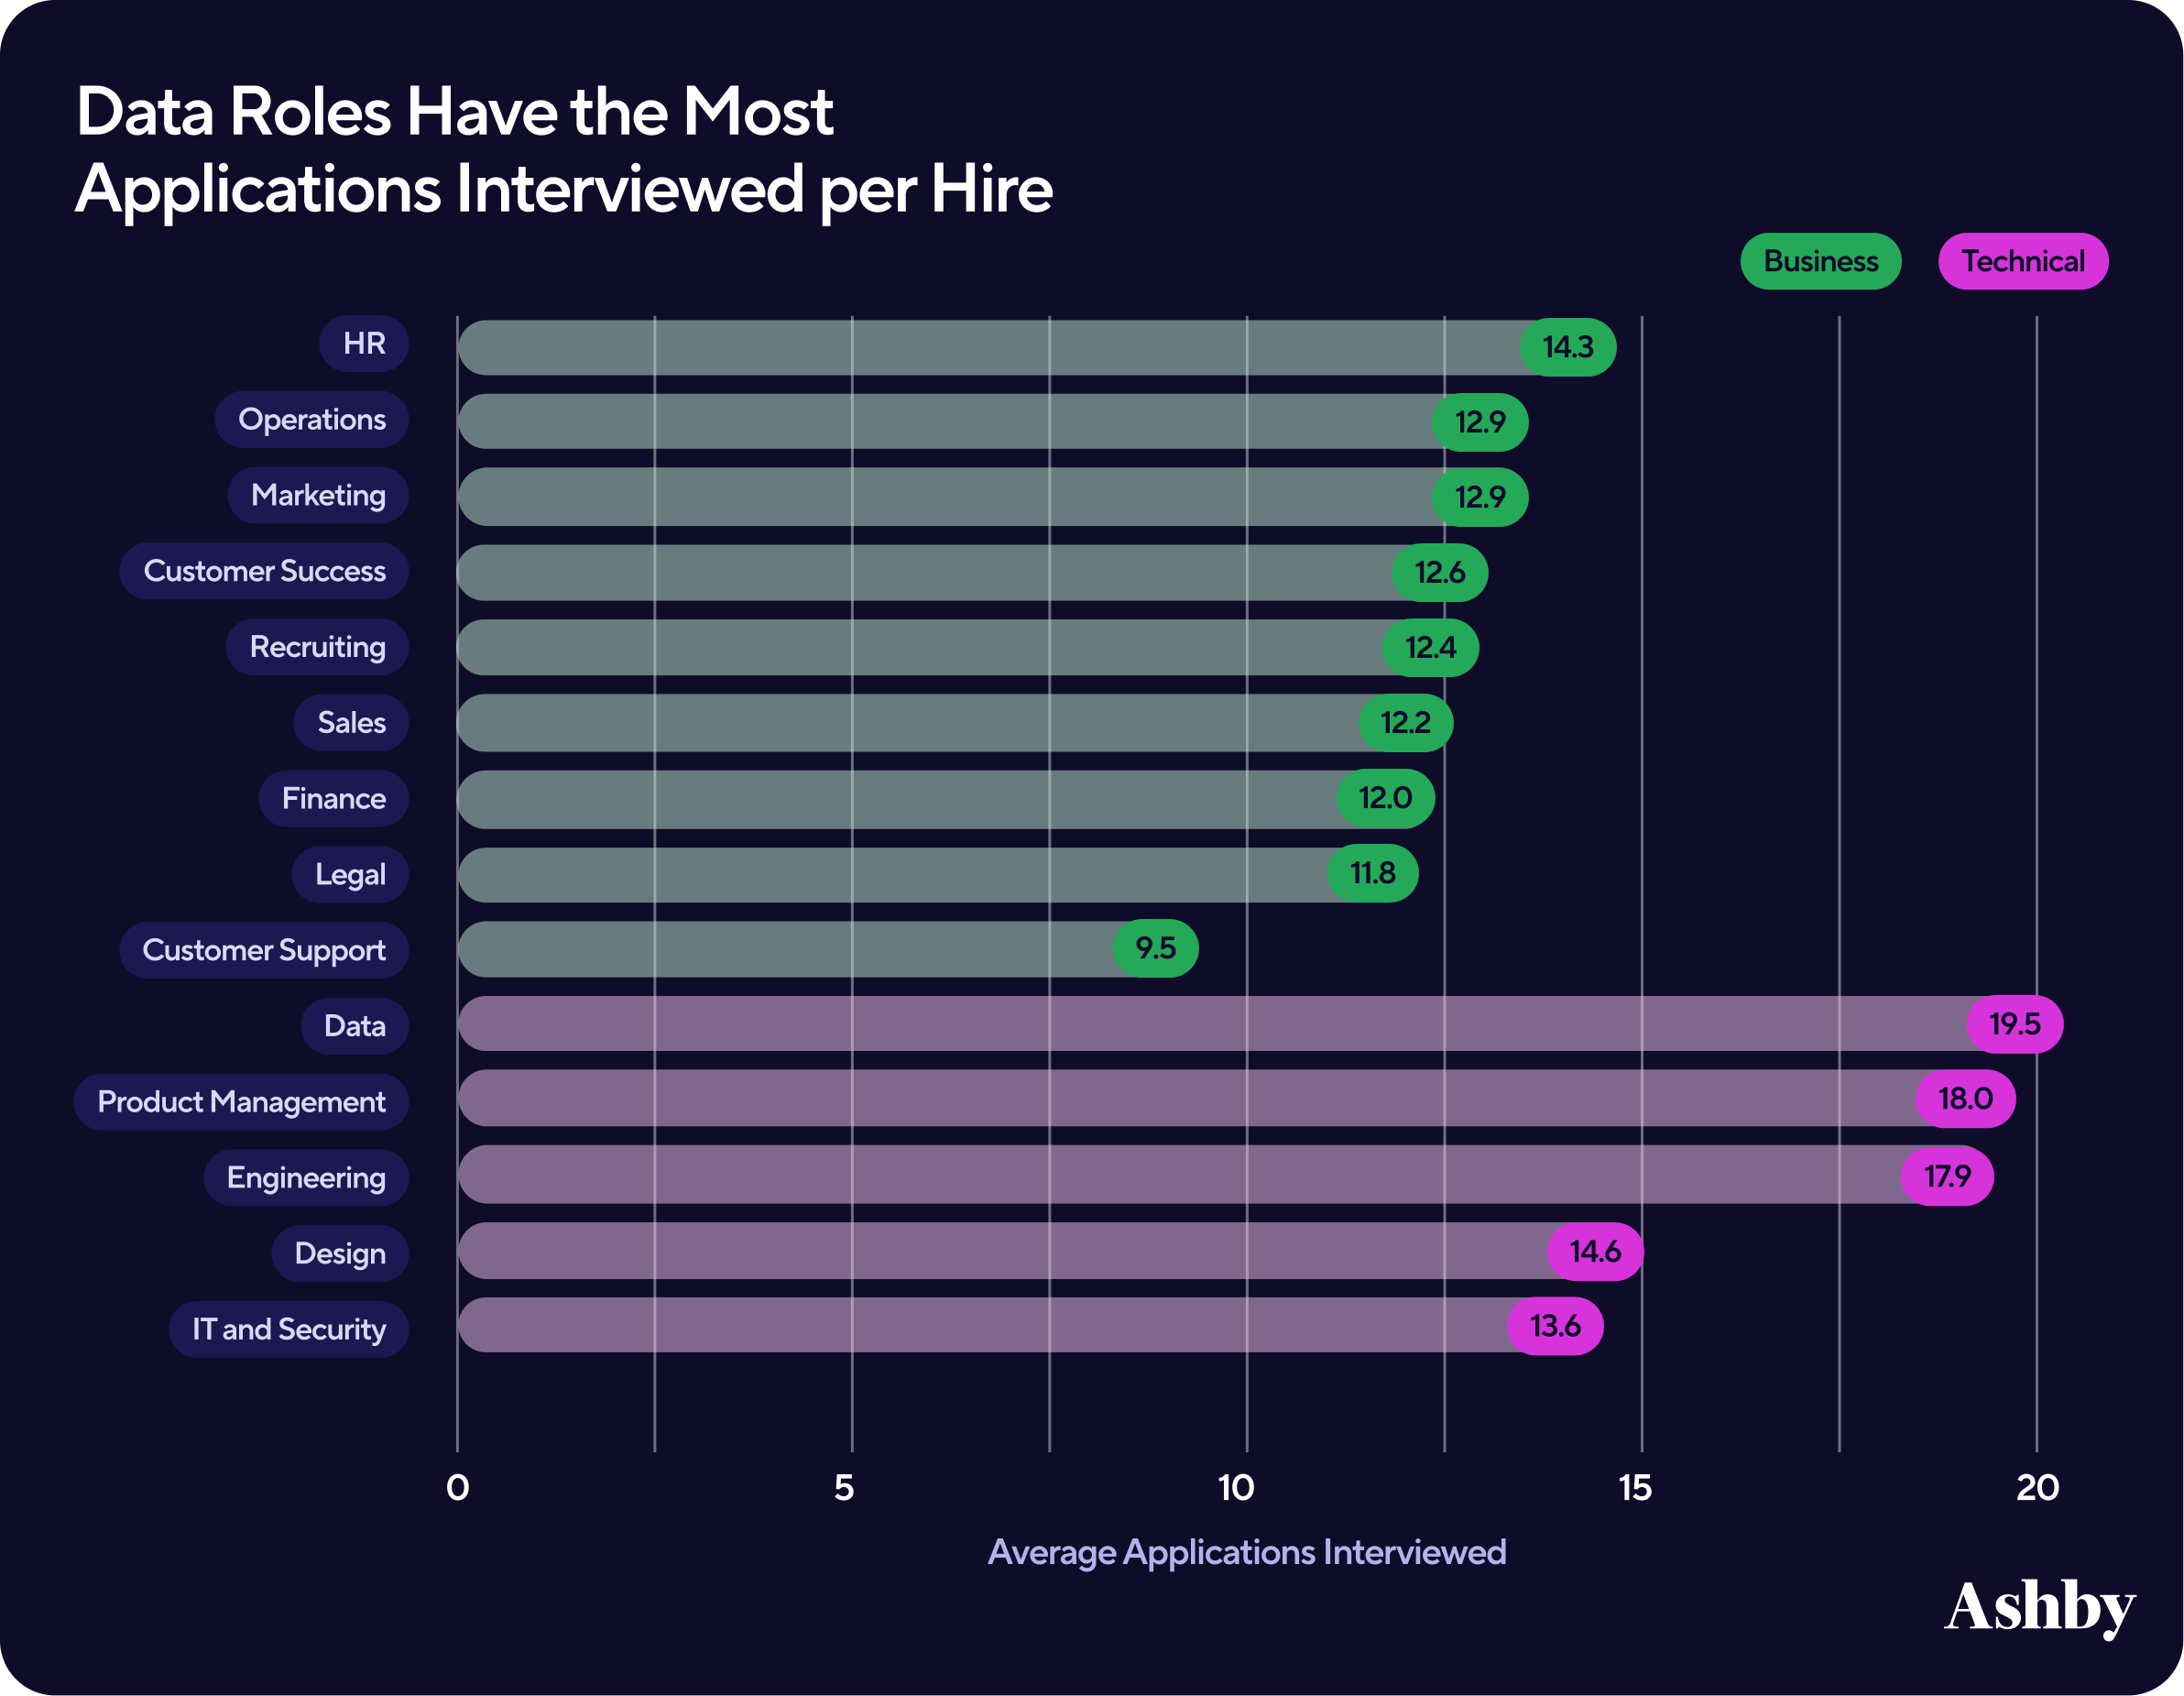
Data roles have the most applications Interviewed per Hire
We segmented this same data by job role, looking specifically from Q1 2025 to Q1 2026, and interesting trends emerged. Some roles, like Customer Support, have far fewer interviews compared to other roles like Data and Product Management.
- Data roles average the most interviews of any category at 19.5 per hire, followed by Product Management at 18 and Engineering at 17.9.
- Customer support roles average just 9.5 interviews per hire, the lowest of any category.
- HR roles sit at 14.3 interviews per hire on average, higher than Sales, Marketing, and Operations.
The gap between Data and Customer Support alone is more than 10 interviews per hire. The difference has real implications for how recruiting teams plan capacity, coordinate schedules, and set hiring managers expectations depending on the role they are filling.
That gap becomes even more pronounced when you look at Interview Hours per Hire rather than count.
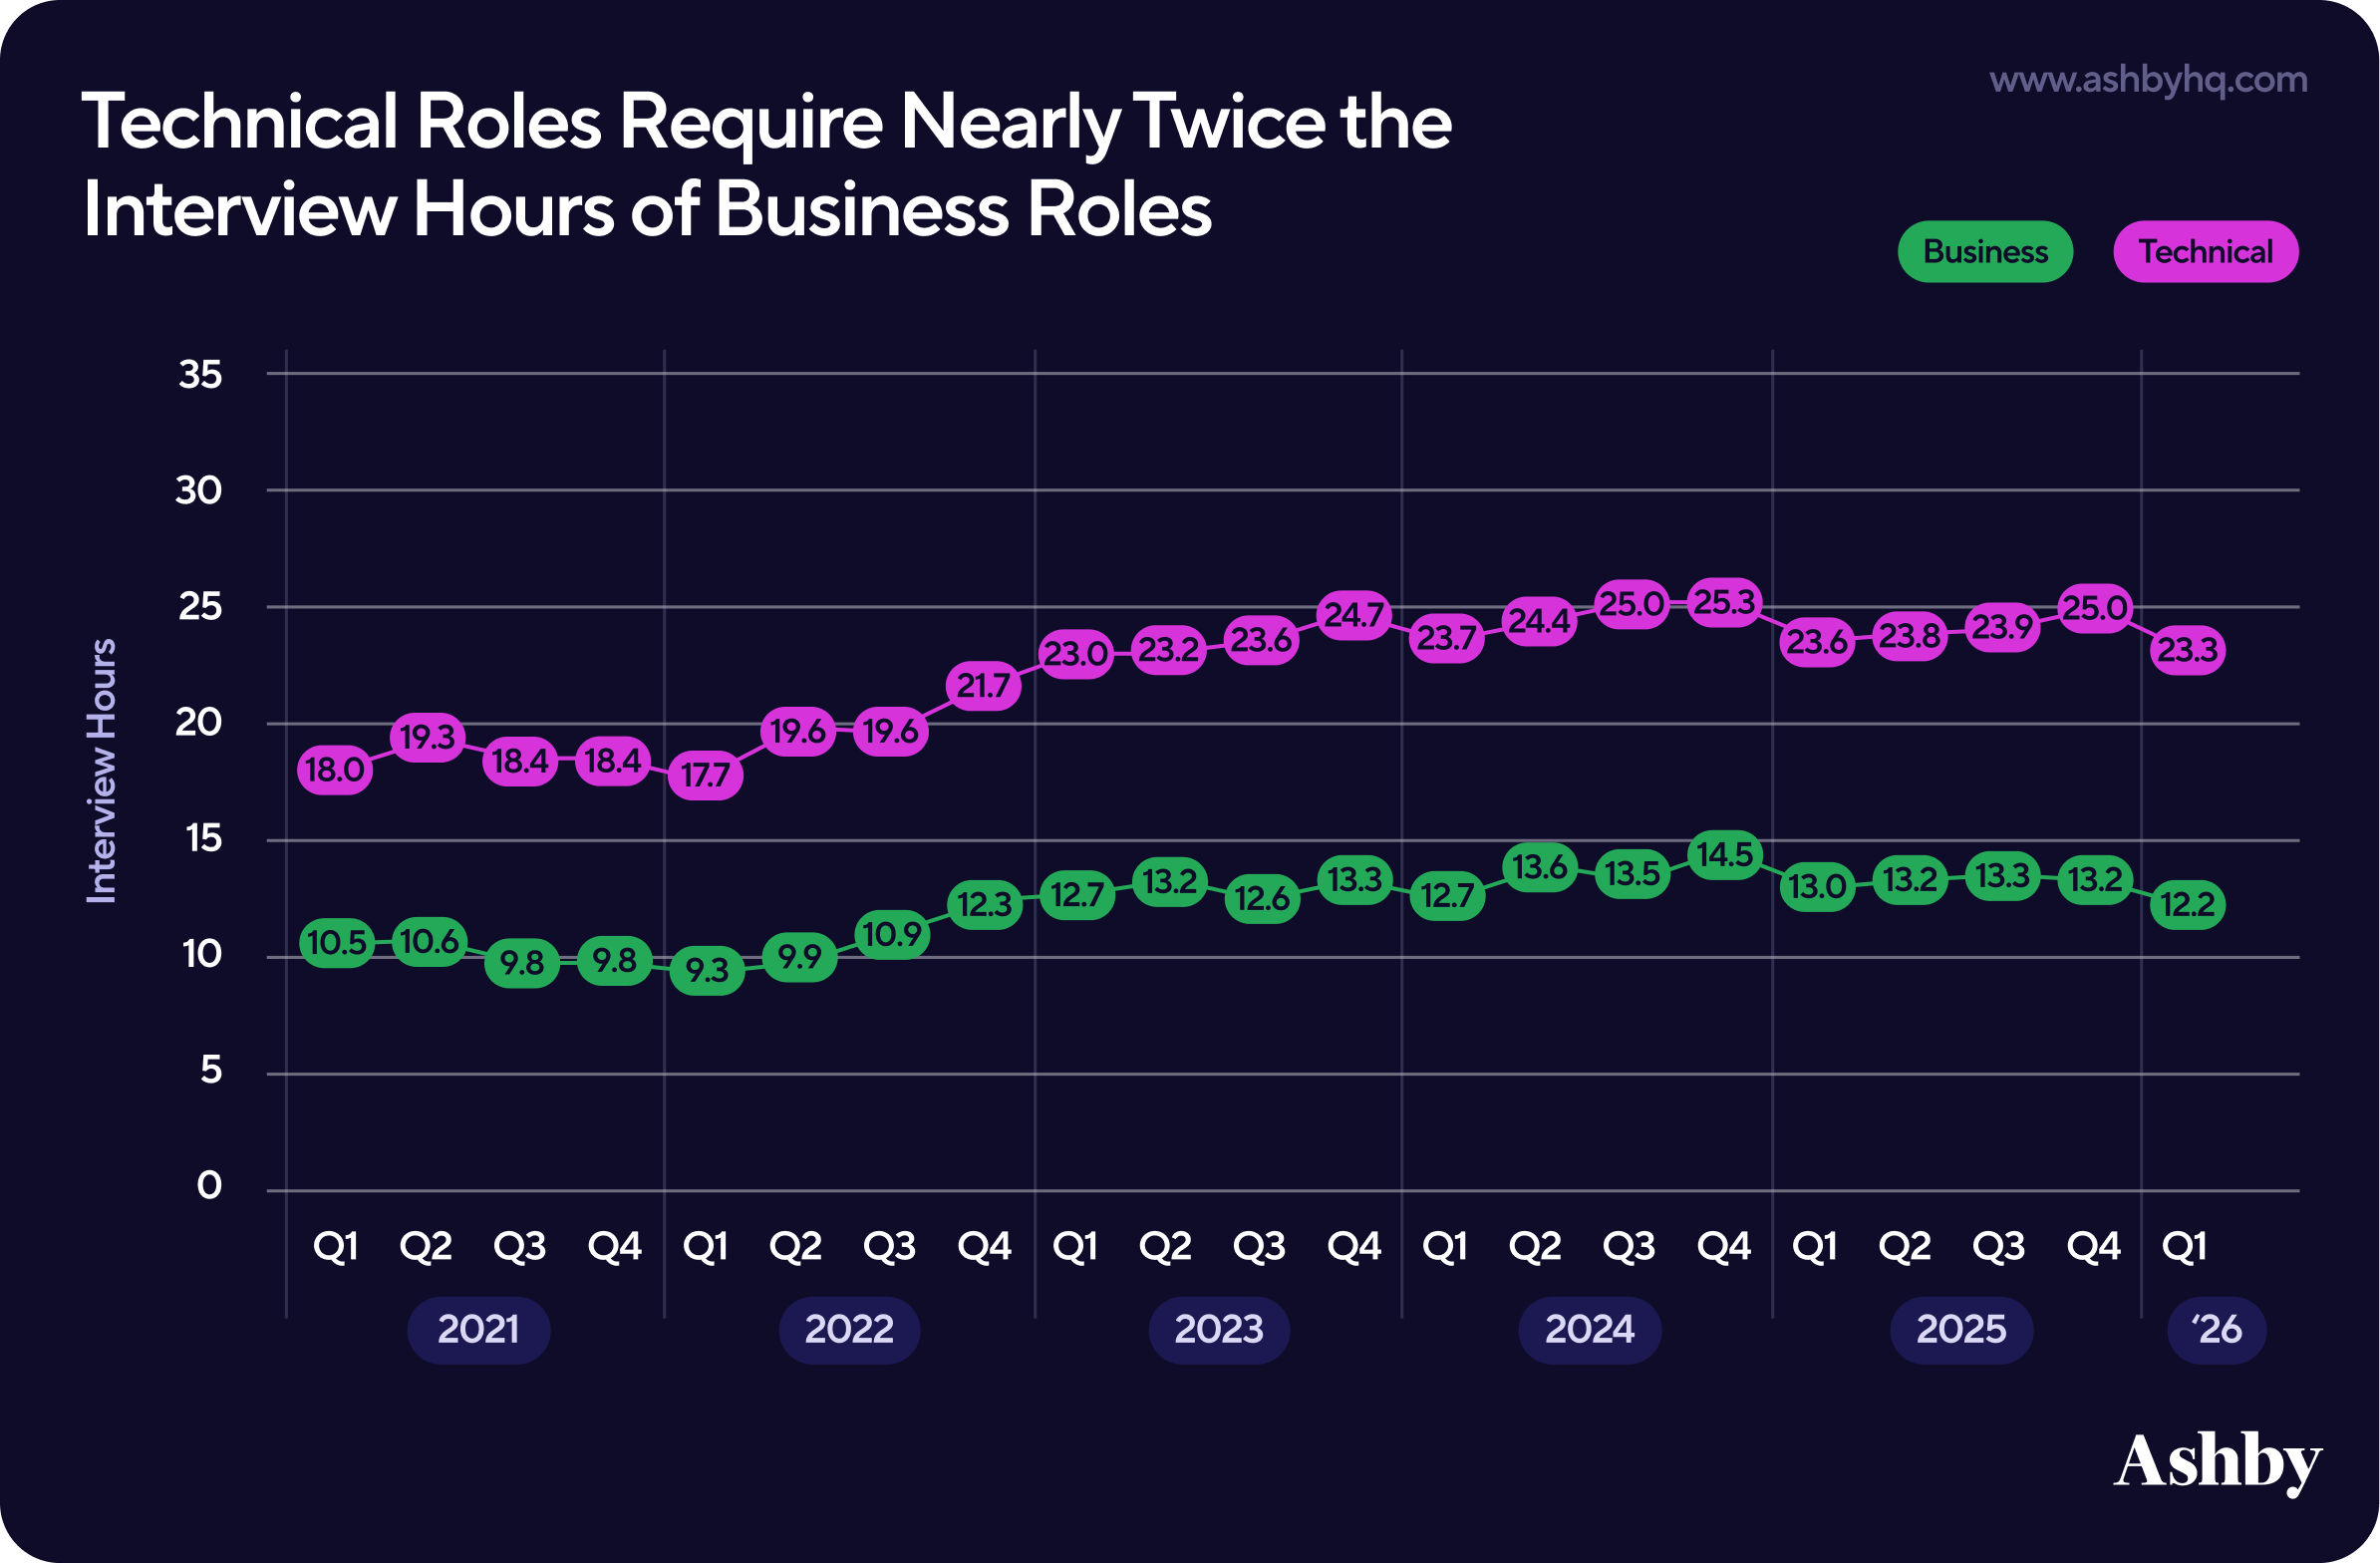
Technical roles average nearly twice the interview hours than business roles
Not only do technical roles require more interviews than business roles, those interviews also run longer.
- By Q1 2026, the average technical hire averaged 23.3 hours of total interview time compared to 12.2 hours for a business hire. That is nearly twice as much interview time relative to business roles, or more than 11 additional hours per hire.
- Both numbers have stabilized since mid-2023 after rising sharply in 2022, suggesting the market has found its ceiling on interview intensity.
In anecdotal conversations with the hiring teams we speak to daily, Quality of Hire continues to be a top priority. This is a stark shift from the 2021 mindset of “hire at all costs,” which may be what we are seeing visualized in these charts. Teams are investing more time in interviews to ensure they hire the right person for the role.
Quality of Hire in Ashby: Talent teams can use Ashby to survey hiring managers on a customizable cadence (e.g., 30/60/90 days of onboarding) to complete new hire assessments. The surveys themselves are lightweight, while the data collected provides a source of truth for what channel sources, recruiters, or other factors lead to quality candidates and ultimately hires. Learn more here.
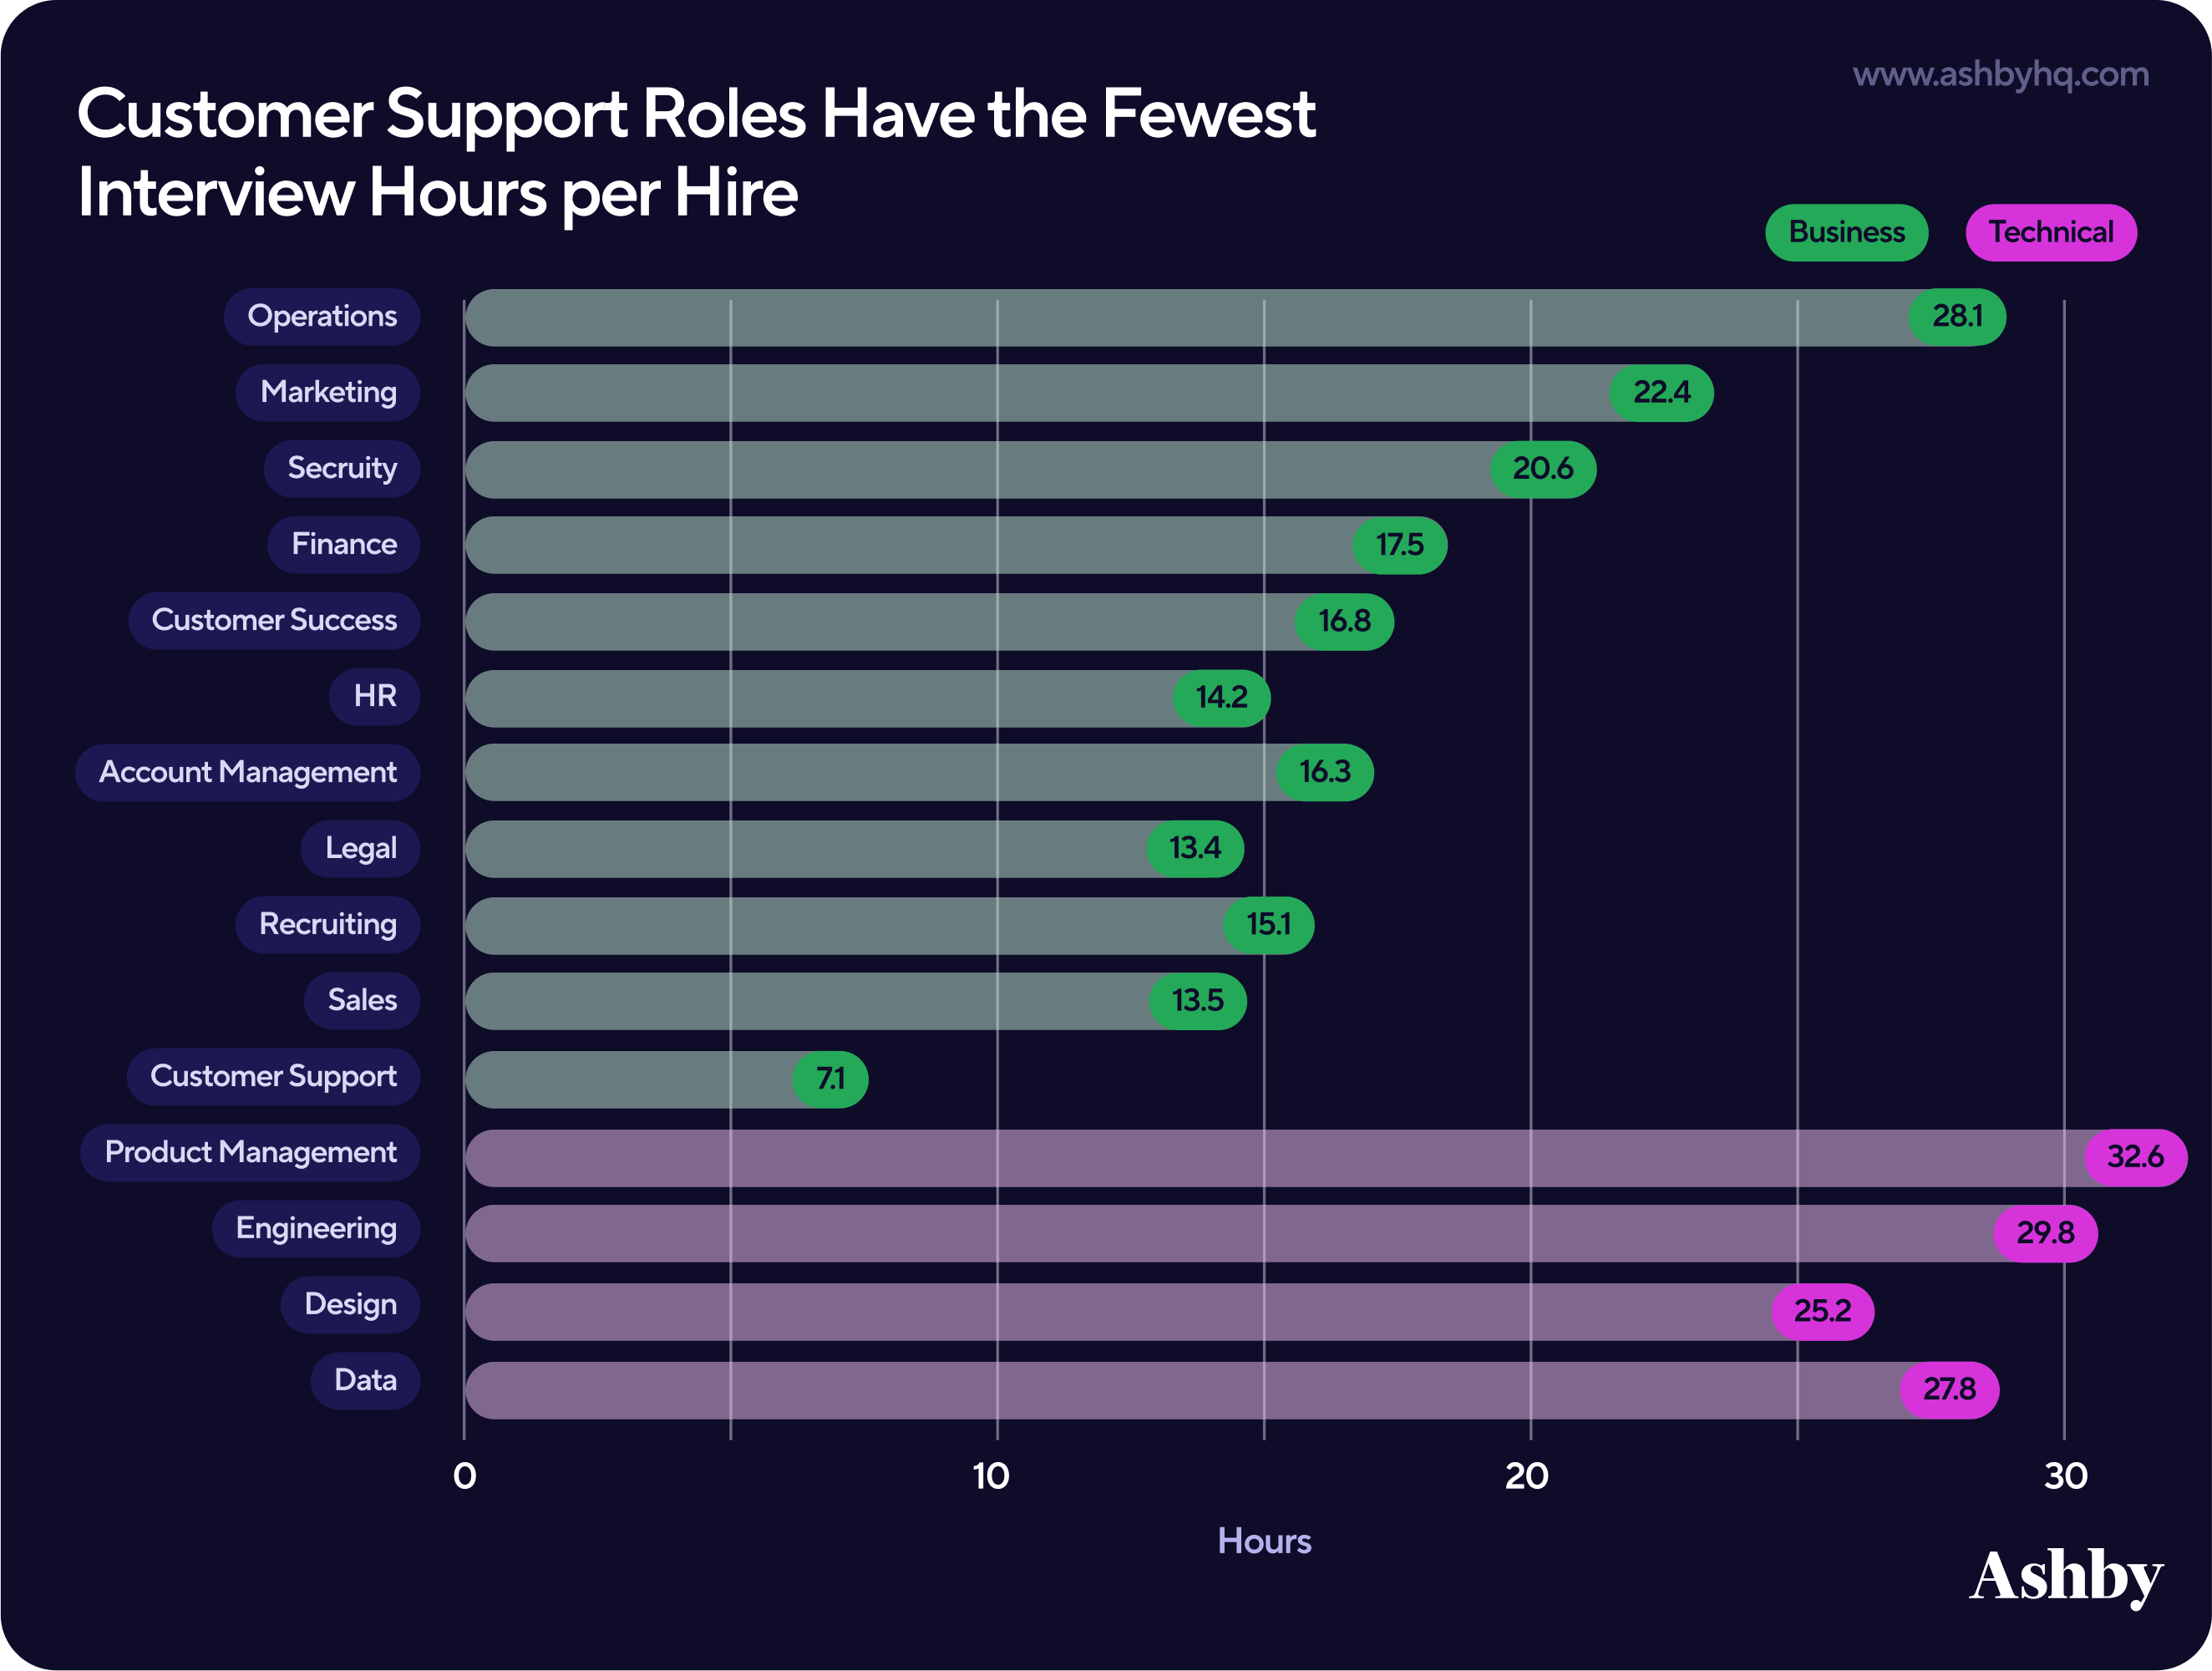
Customer Support roles have the fewest Interview Hours per Hire
The gap between technical and business roles is clear at the functional level and when you break it down further by job function, the differences become even more pronounced. Some roles demand a significantly higher time investment than others.
- Data roles top the chart averaging 24.9 hours per hire, followed by Engineering at 24.7 and Product Management at 23.5.
- Customer Support sits at the bottom averaging 8.9 hours, a more than 3x difference between the most and least interview-intensive roles.
Technical interview time is far less predictable than business roles
The gap between technical and business interview intensity is a consistent theme throughout this report. When you look at how interview hours are distributed across hired candidates, that story holds. Business roles cluster between one and three hours on average of total interview time. Technical roles show a much wider spread, with some hires averaging up to 10 hours of total interview time.
- Approximately 23% of technical hires average five or more hours of total interview time, compared to just 6% of business hires.
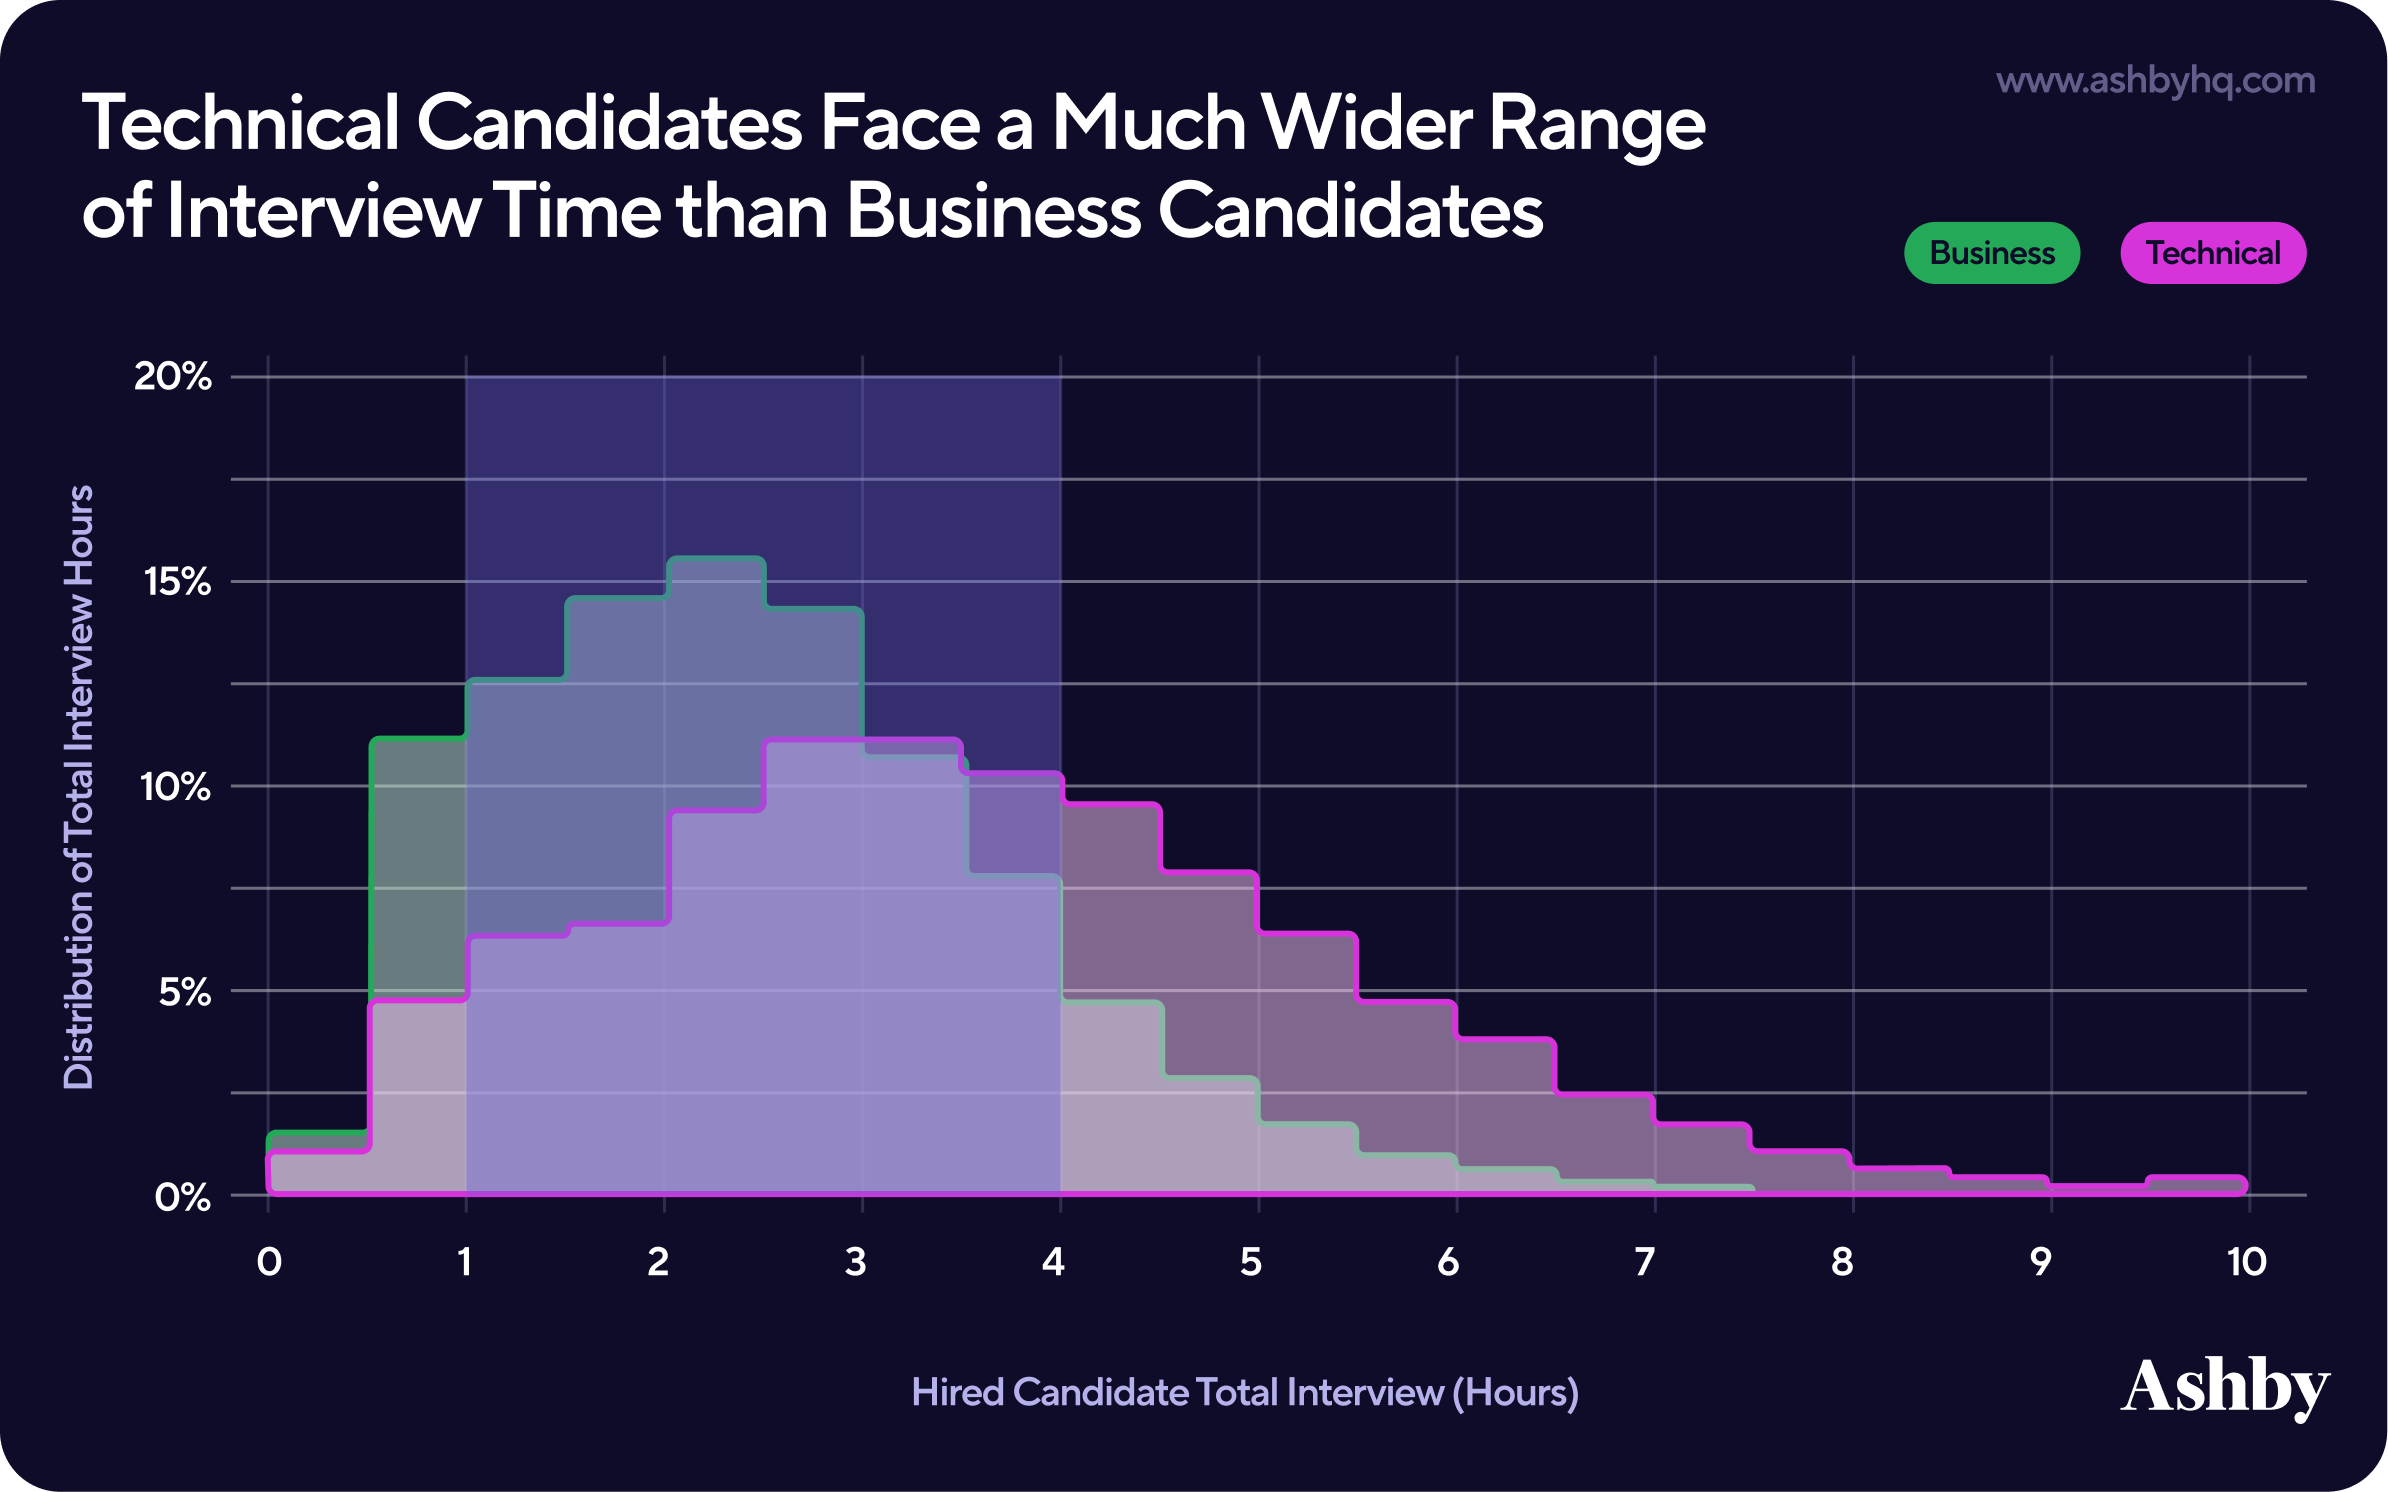
Technical hiring is far less predictable, which makes it harder for recruiting teams to plan. For organizations hiring across both functions, the difference in time and coordination demands are meaningfully higher throughout the process.
Part 3: Funnel Conversion and The Candidate Experience
With application volume elevated and interview intensity higher than it was a few years ago, we wanted to understand what that means on the other side of the equation. We took a look at funnel conversion to help recruiting teams understand where candidates are dropping off or moving through the interview process and the overall candidate experience.
Candidates are roughly 50% less likely to receive an interview today than they were five years ago
- In 2021, approximately 7-8% of applications resulted in an interview. Today that figure sits between 3.6% and 4.7% depending on role type.
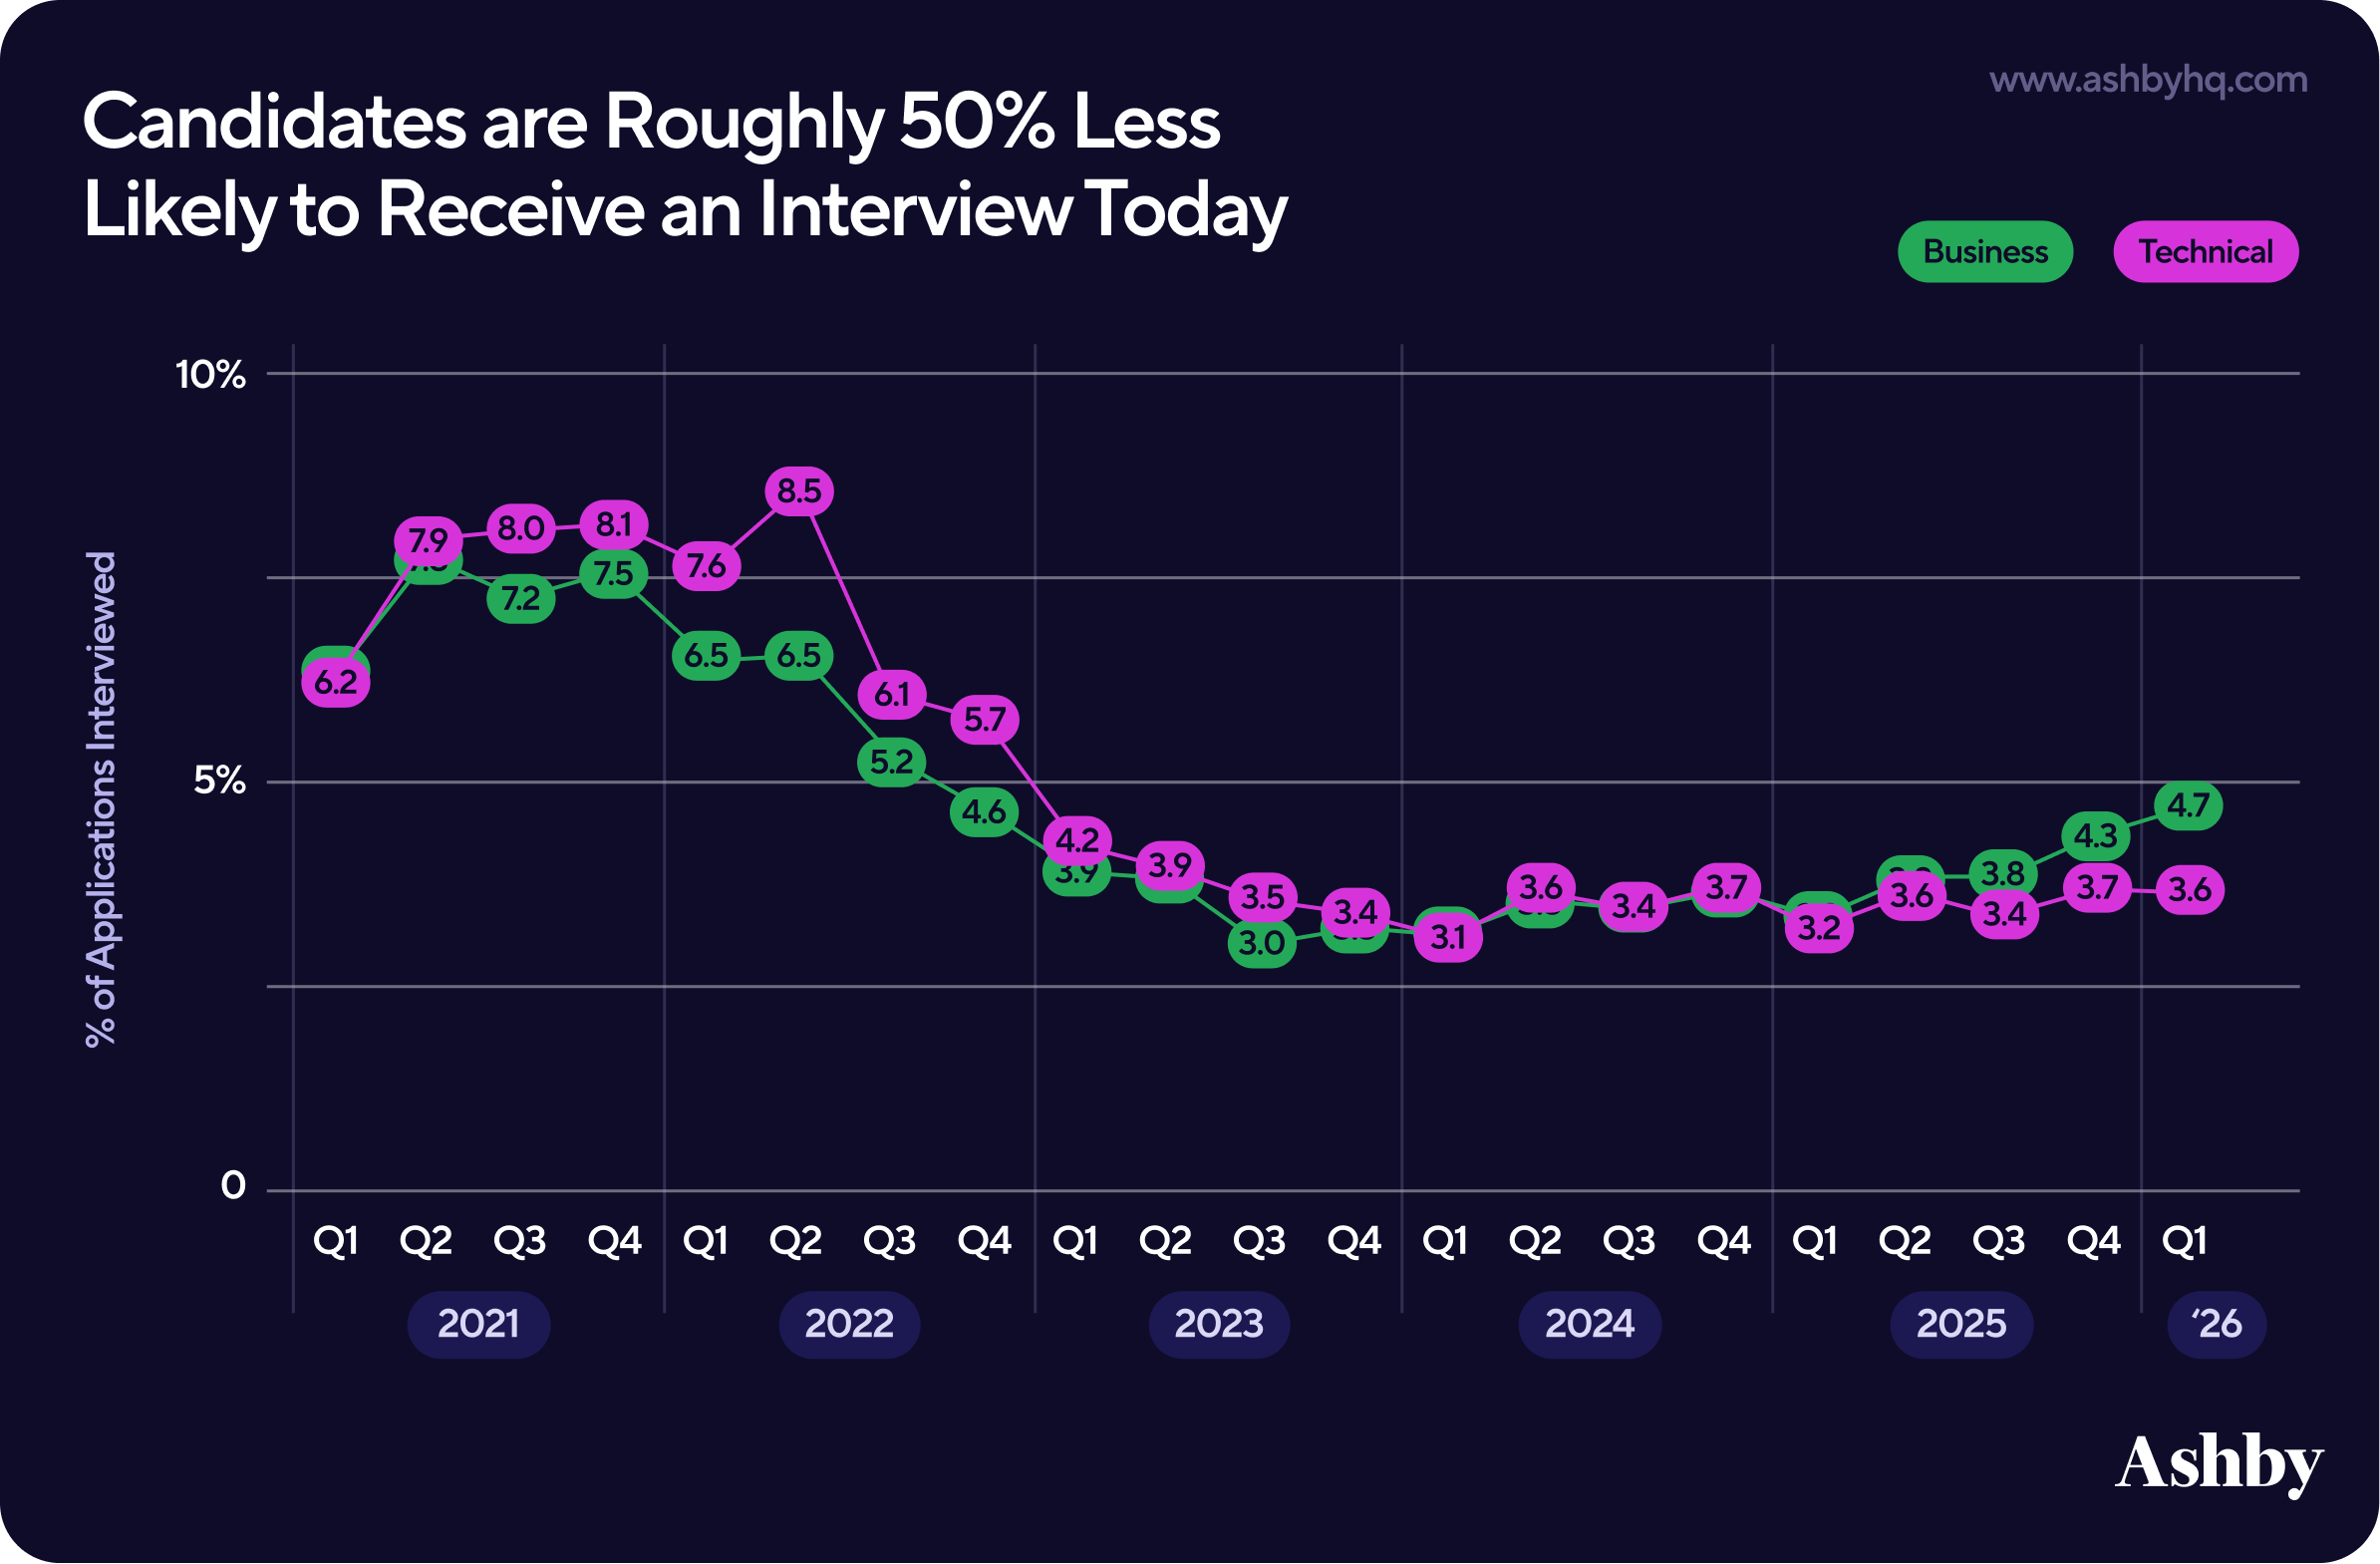
These numbers aren’t surprising, since we know Applications per Hire has increased. Recruiters aren’t being selective by choice; instead, application volumes continue increasing from talent supply as well as an increase in fraudulent applications.
Many of the talent teams we speak with are seeing a rise in AI-generated applications submitted by automated tools. This makes it harder to identify genuine candidates and adds friction to a process that is already resource-constrained. The result is a more competitive environment for job seekers, even when recruiter capacity and hiring intent have both recovered.
Fraudulent Candidate Detection and Management in Ashby: Talent teams can select automatic fraud detection for candidates that submit an online application. If selected, Ashby will automatically identify, signal, and manage potentially fake applications to protect hiring pipelines. It flags risks such as inconsistent location, IP, or email issues without interrupting the experience for legitimate candidates. Learn more here
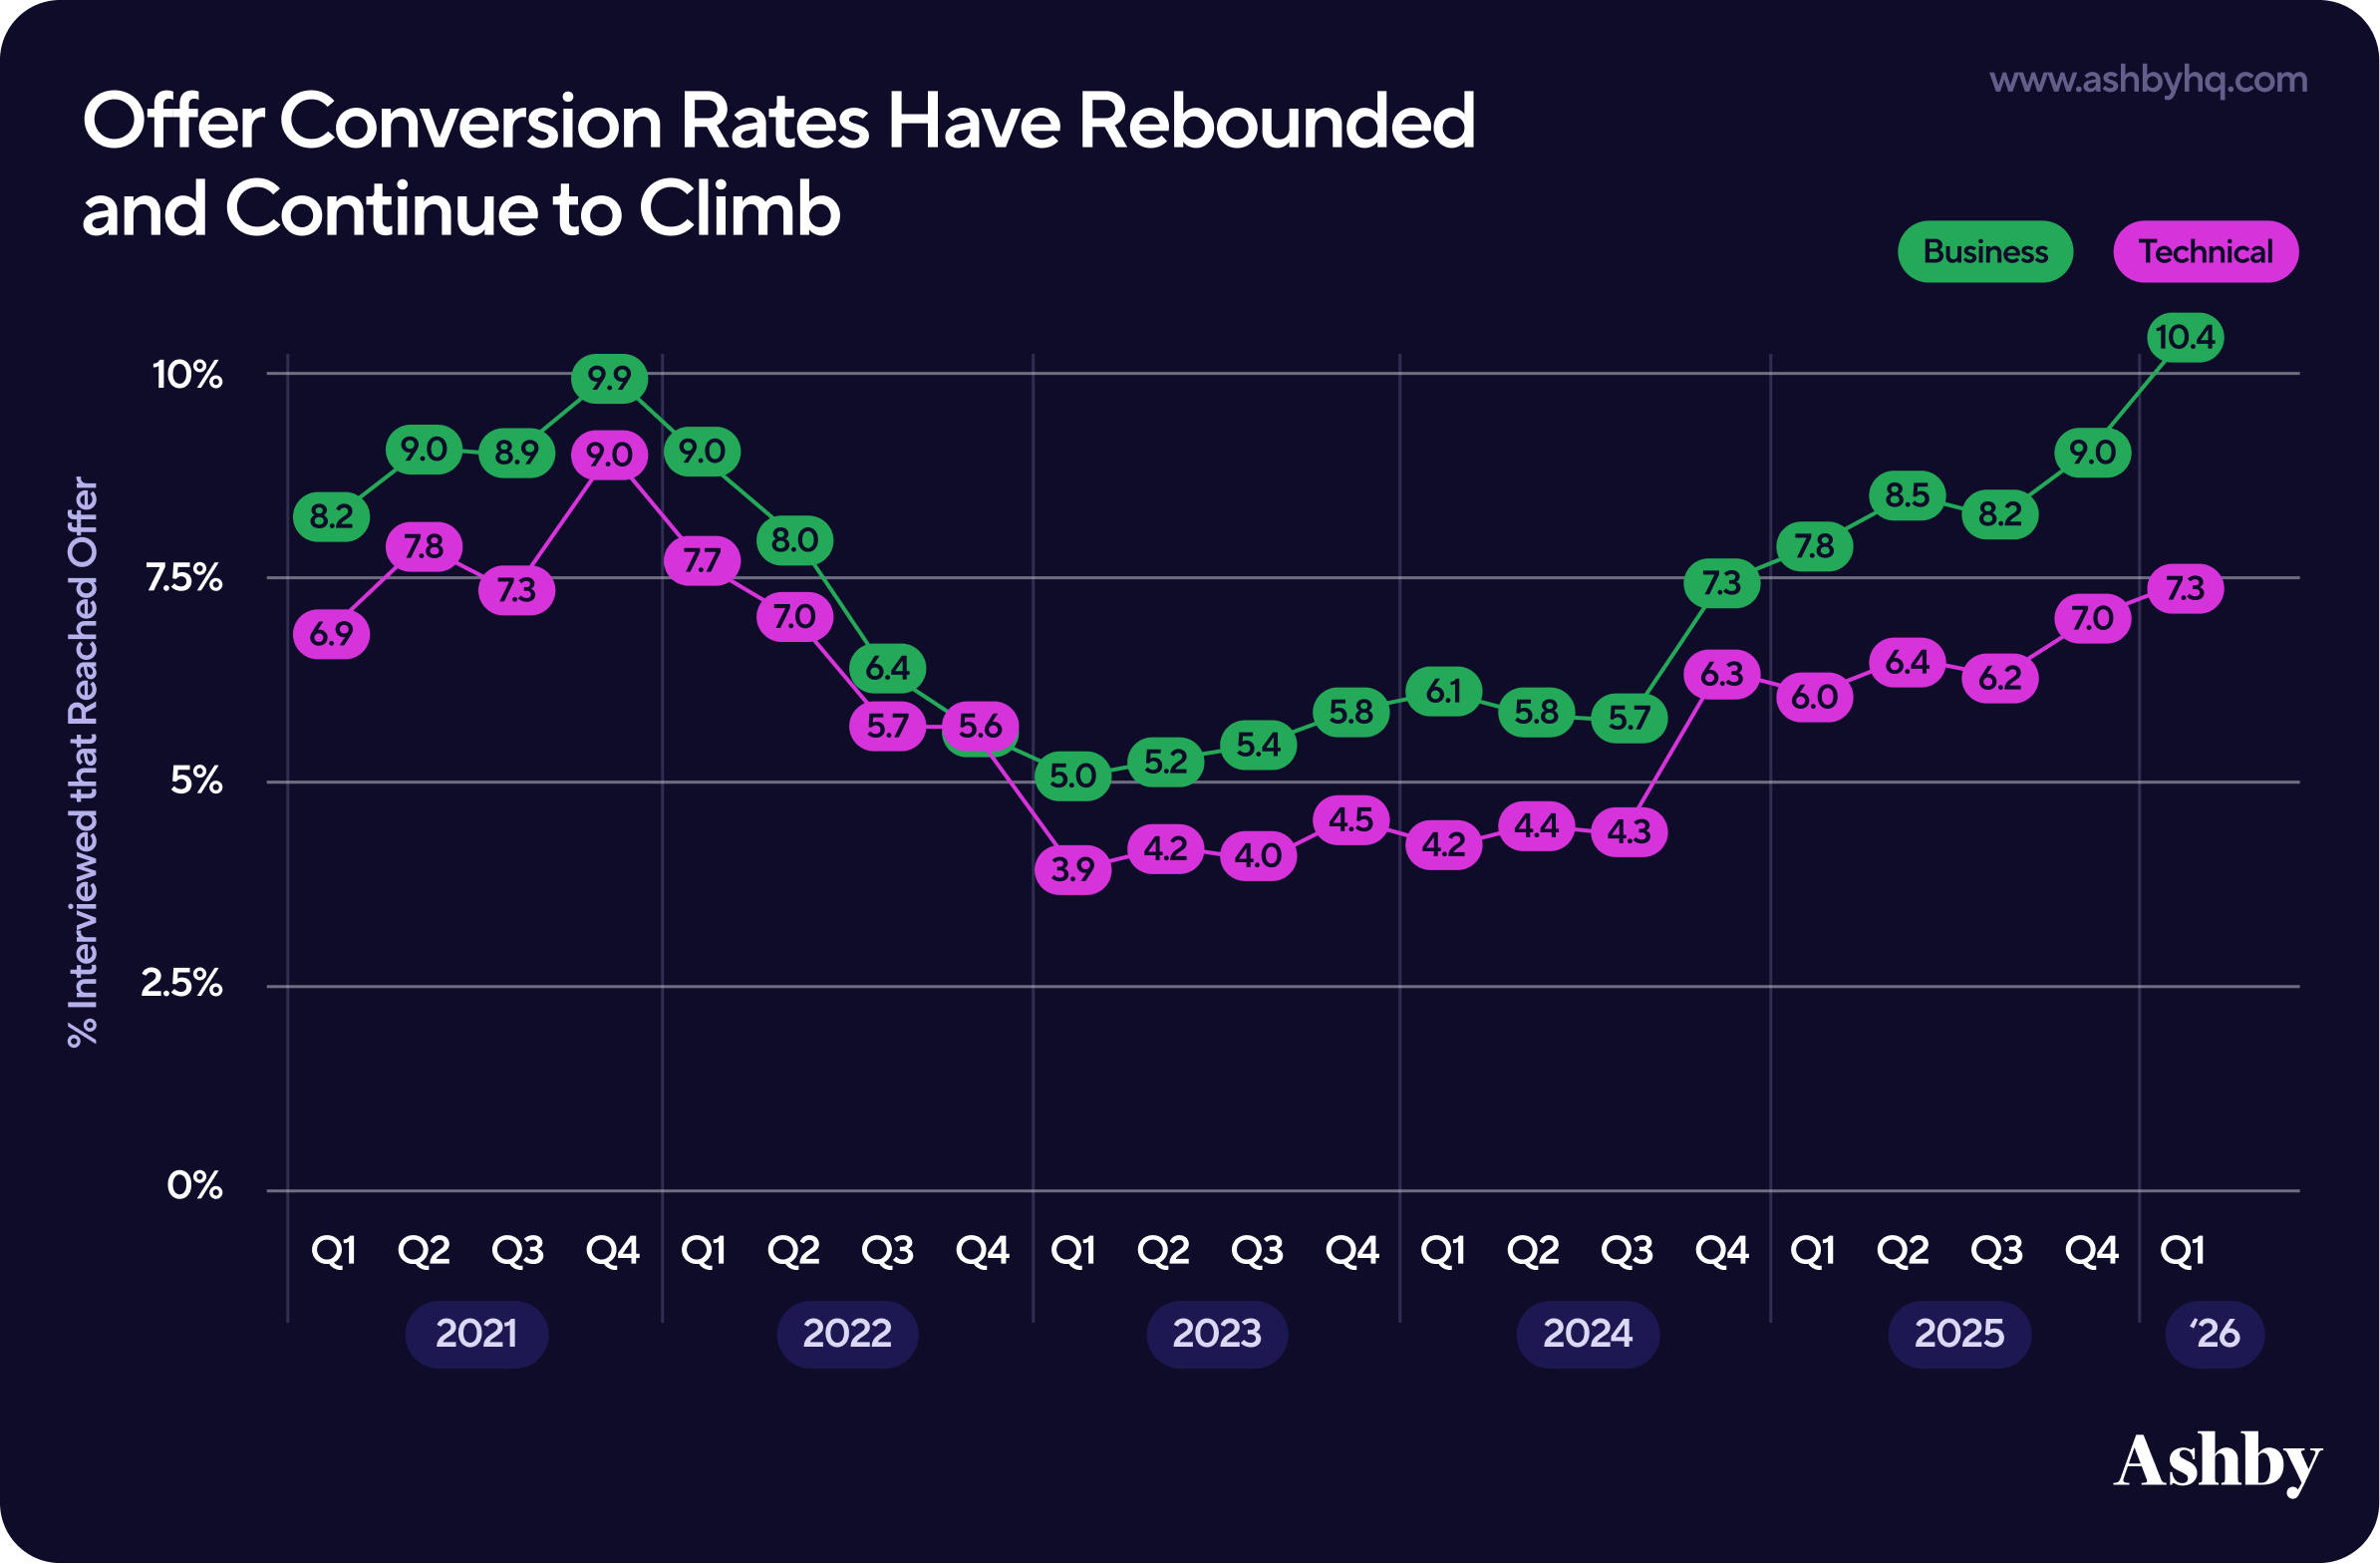
Once in the process, candidates are more likely to receive an offer
Securing an interview has become harder, but making it into the process matters more than ever. Offer conversion rates have rebounded and continue to climb.
- After hitting a low of 3.9% for technical roles and 5% for business roles in early 2023, offer conversion rates have climbed steadily.
- By Q1 2026, offer conversion rates have not just recovered, they have surpassed the 2021 levels.
- On average, business roles reached 10.4% and technical roles reached 7.3%.
This is an encouraging sign for recruiting teams and job seekers alike. The funnel has become more selective at the top, but candidates who make it into the interview process are converting to offers at the highest rates we have seen in this analysis. Fewer candidates are being brought in, but the ones who are tend to be the right fit.
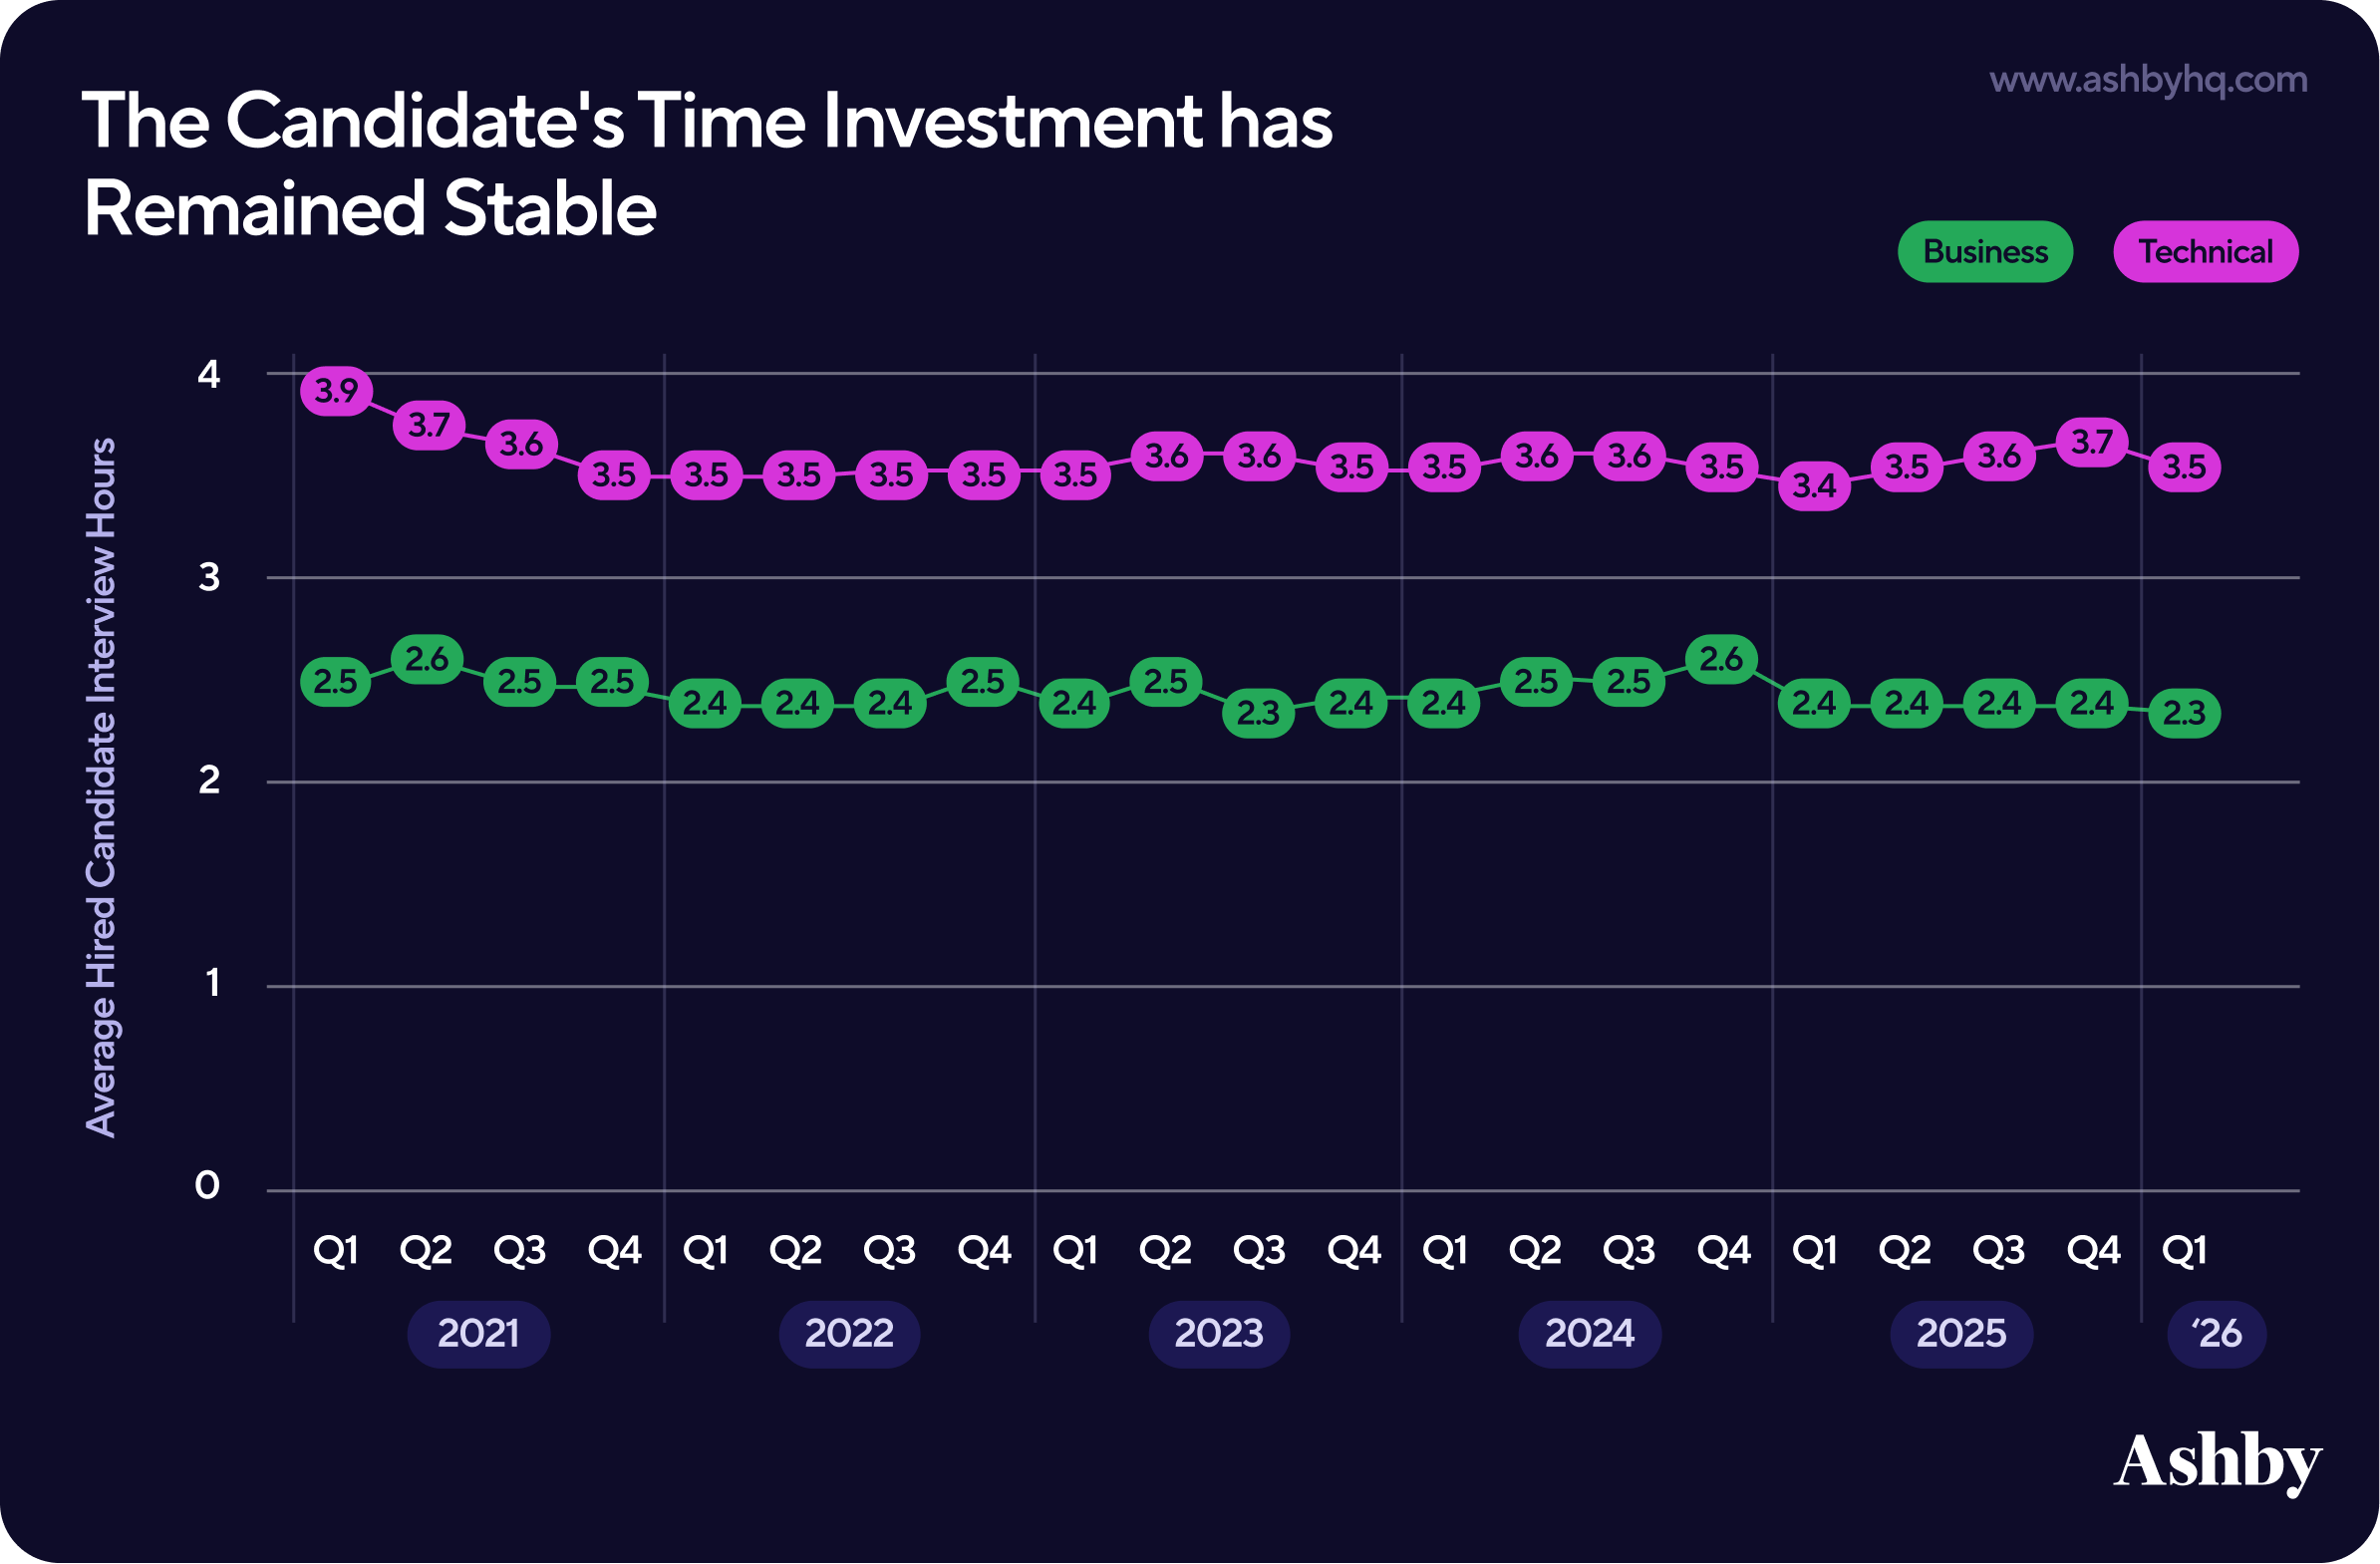
The candidate's time investment has remained stable
Despite everything that has changed on the recruiter side, the experience for the hired candidate has remained consistent.
- Business candidates average approximately 2.4 hours of interviews before receiving an offer.
- Technical candidates average 3.5 hours of interviews before receiving an offer.
- Both figures have held essentially flat since 2021 with no meaningful trend up or down.
For candidates, this is another encouraging finding. The process of getting hired has not become more demanding, even as the competition to get in has intensified. The extra burden has fallen on recruiting teams, not on the people moving through the funnel.
With the candidate experience holding steady, let's turn to how quickly organizations are actually filling roles.
Part 4: Hiring Velocity and Timelines
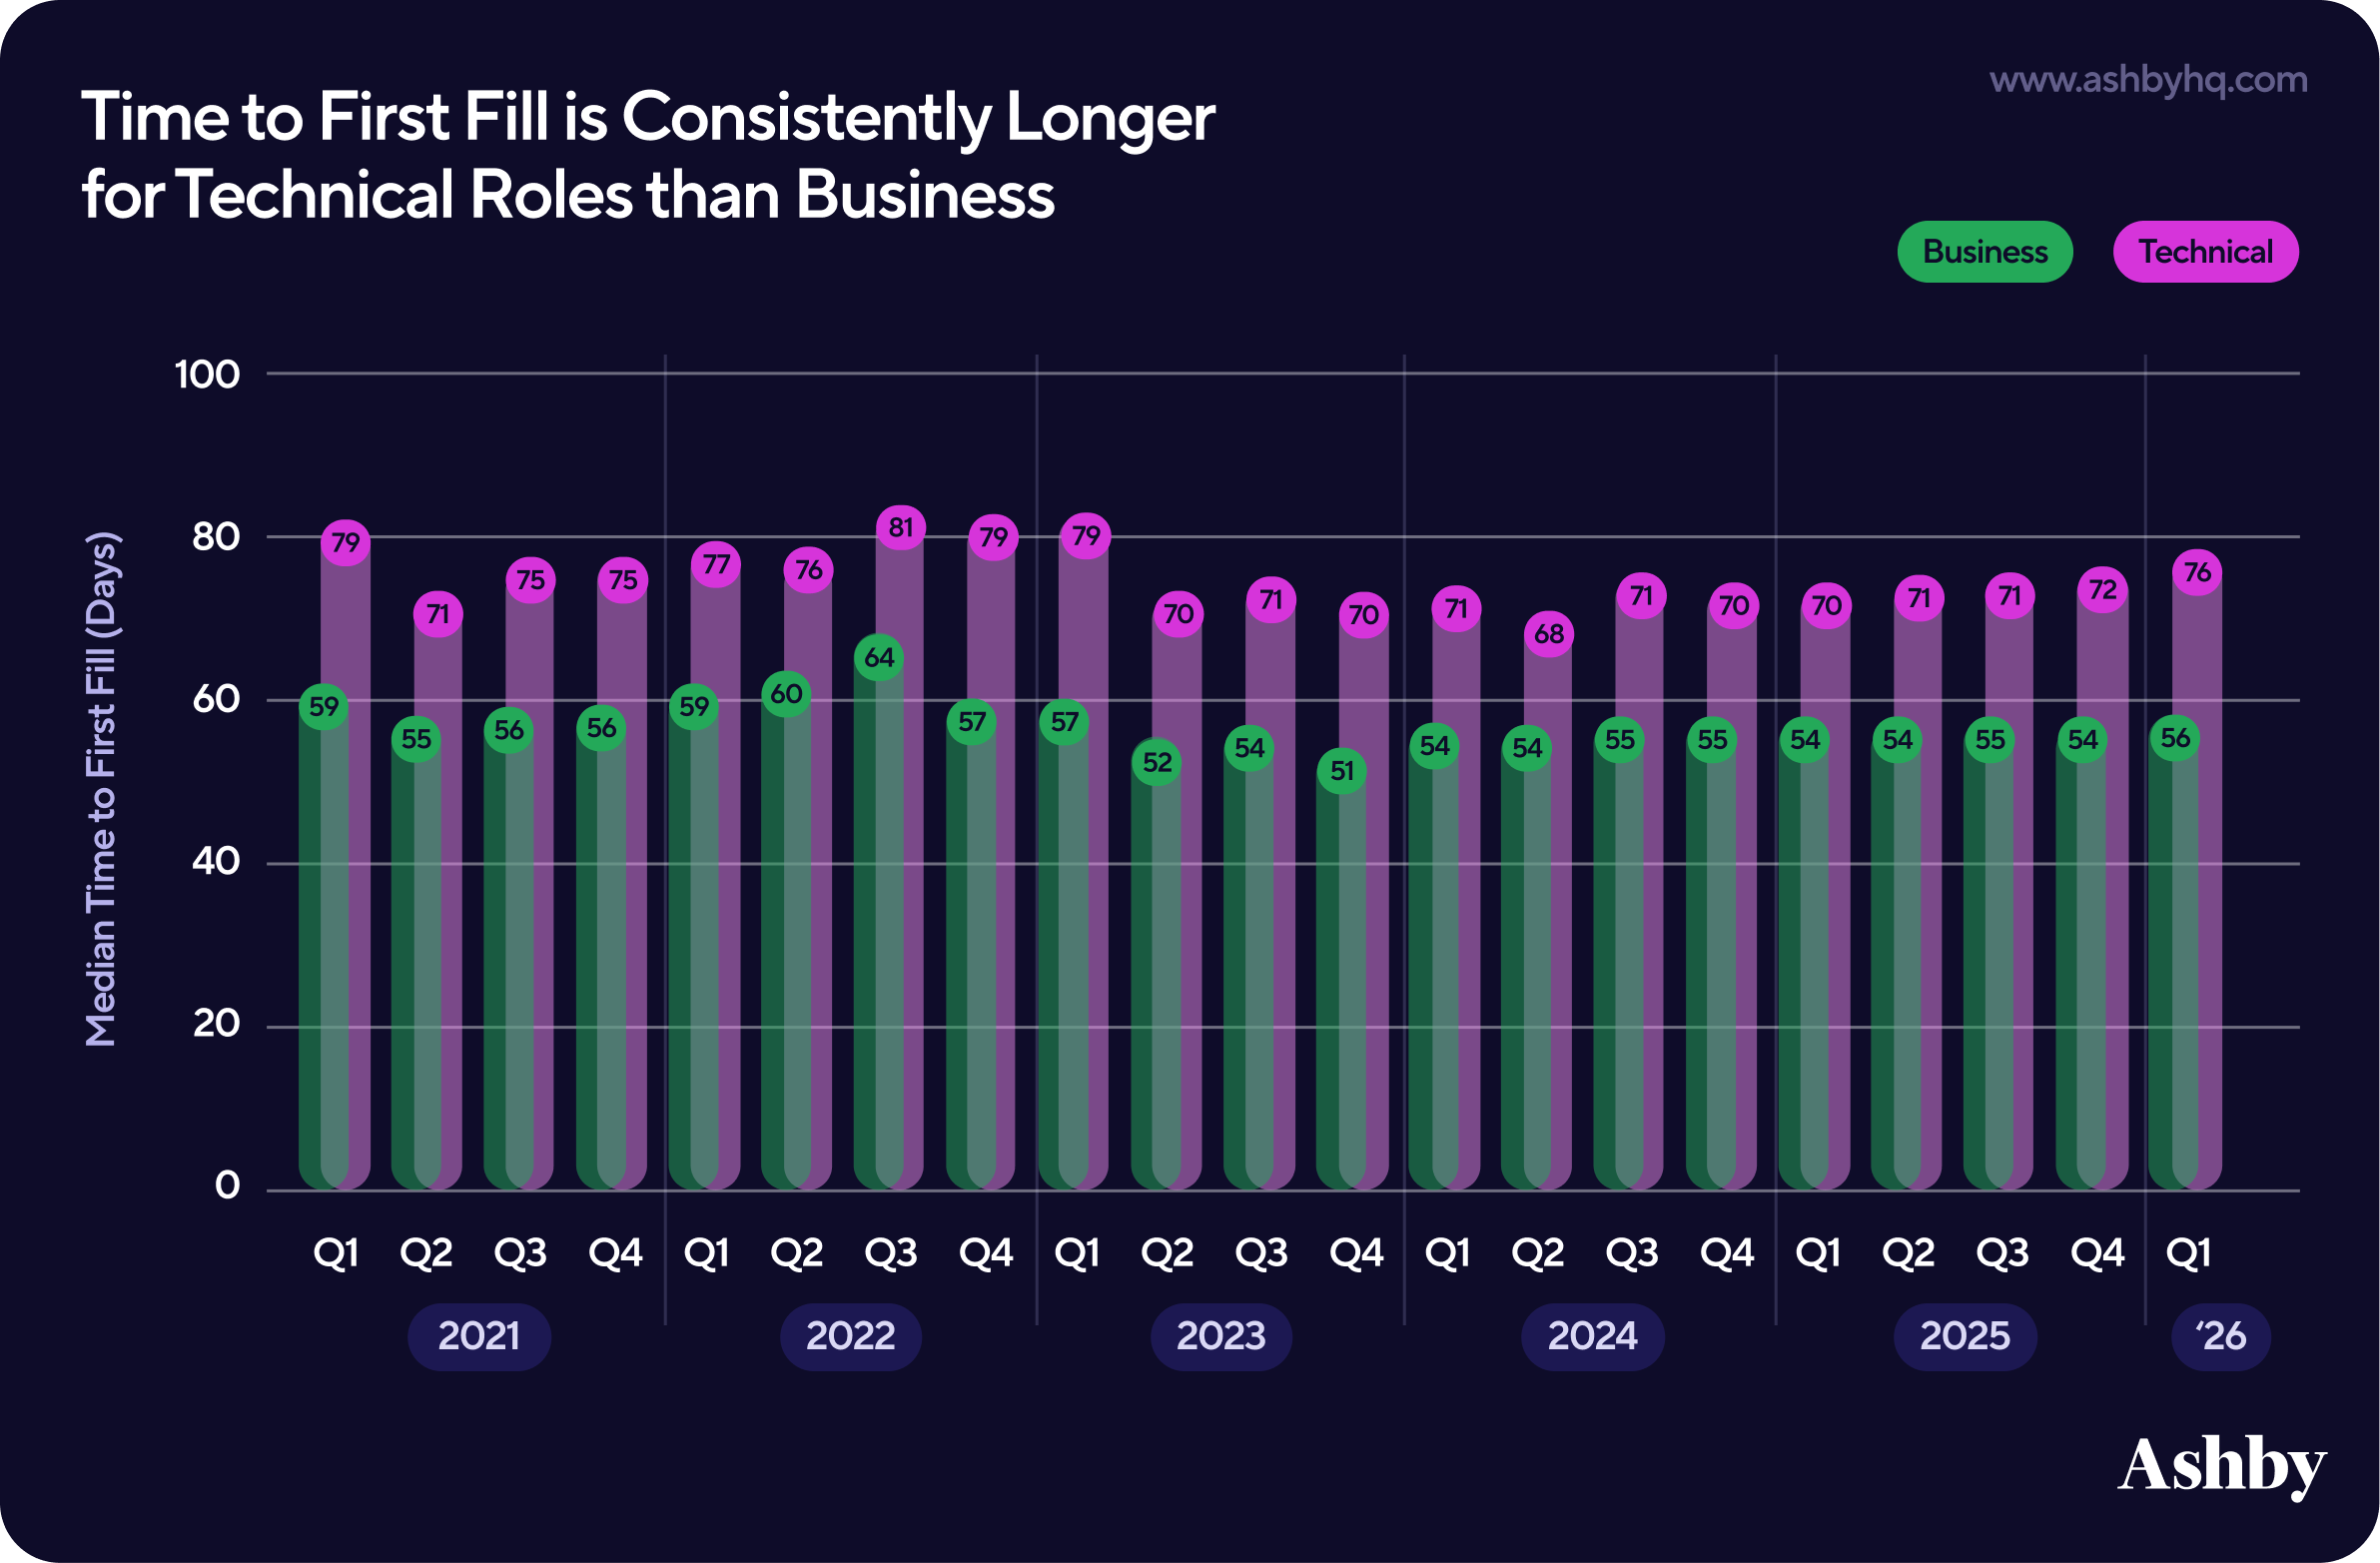
Time to First Fill is consistently longer for technical roles than business roles
We see Time to Fill as an imperfect metric, particularly because a hiring effort can be paused, restarted, or require a new job description, making the timeline difficult to measure consistently. It is also harder to track for evergreen roles with long-term listings and multiple hires over time. That said, we understand it gives a useful signal for what teams can expect when opening a new role for the first time. Our preferred lens is, Time to First Fill, defined as the number of days from when a job was opened to when the first hire was made.
- Since Q2 2023, Time to First Fill has remained steady.
- The median Time to First Fill is 56 days for business roles and 76 days for technical roles. Roughly 8 to 10 weeks.
Note: These figures are reported as medians and reflect additional historical data, which may account for differences from the averages reported in our prior analysis.
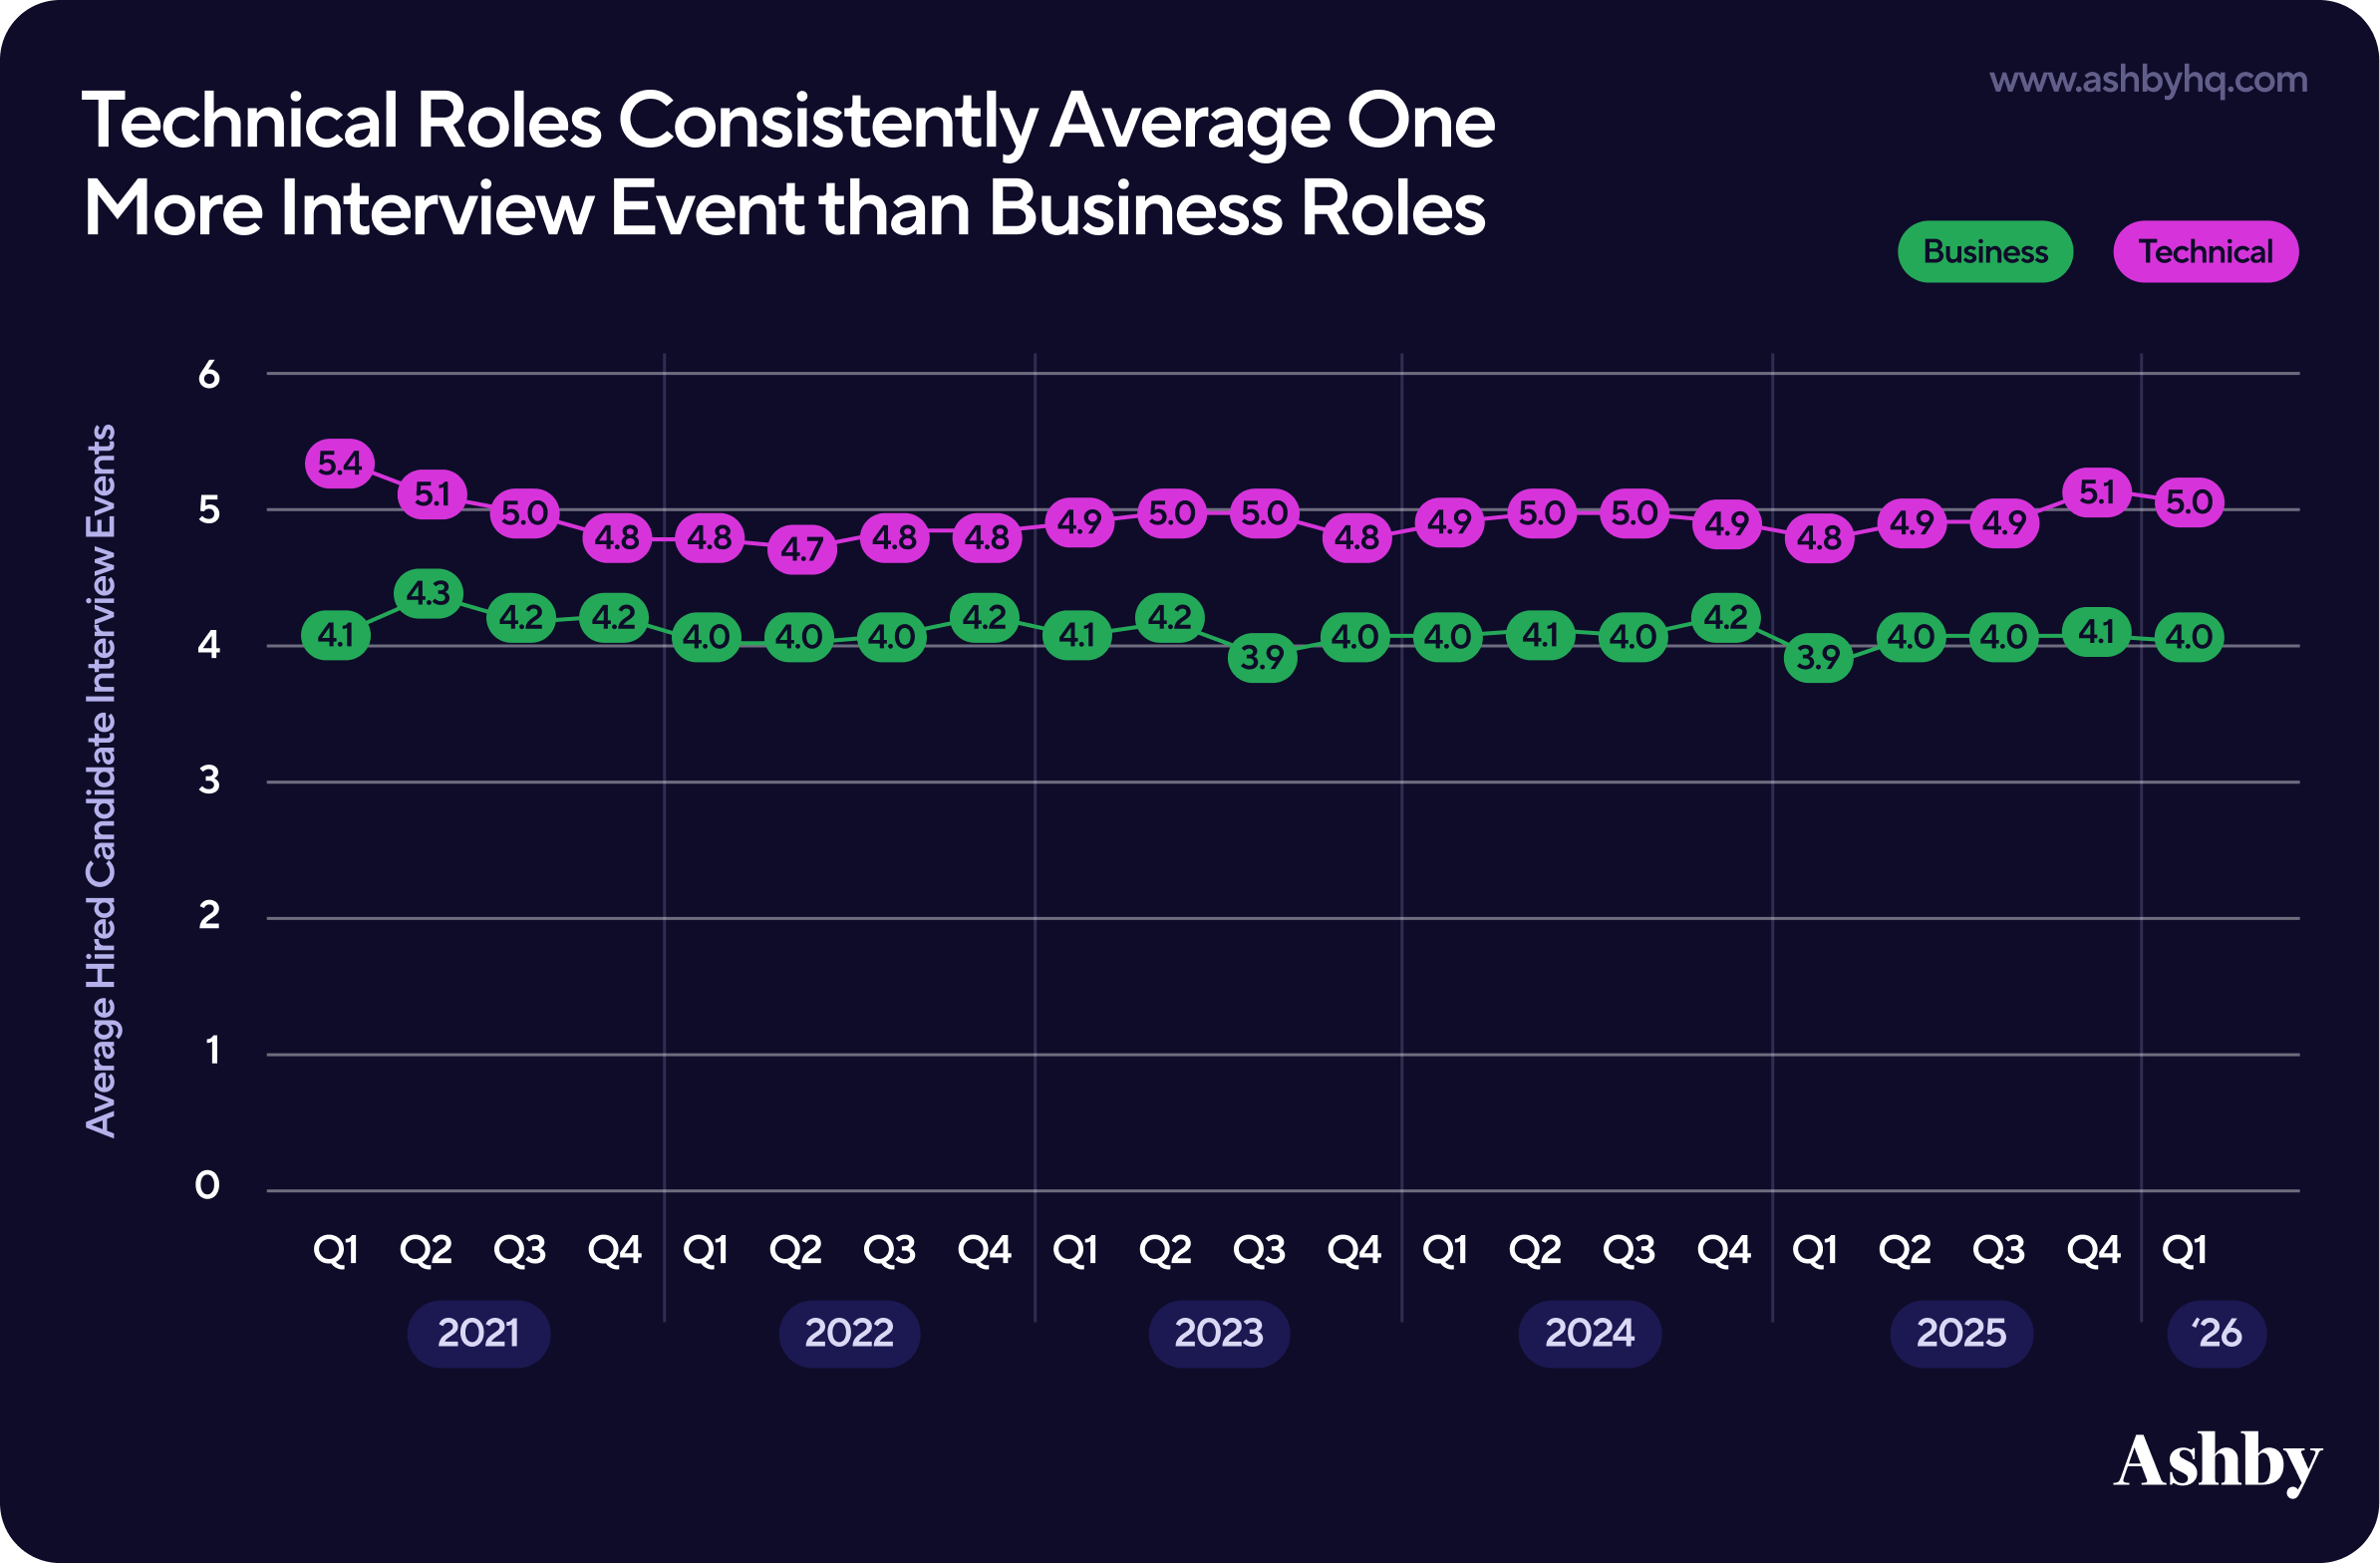
Technical roles average one more interview event, adding a week to the process
An interview event is a scheduled session, either in-person or virtual, between a candidate and the hiring team. Over the period analyzed, Interview Events per Hire have stayed consistent, and we see a gap again between technical and business roles.
- Technical roles average 5 interview events per hire.
- Business roles average 4 events per hire.
One additional interview round may not sound significant, but in practice it adds roughly one week to an already longer hiring process. For technical roles, where Time to First Fill already runs two weeks longer than business roles, every stage matters. Teams hiring for technical positions should factor this into their planning from the start.
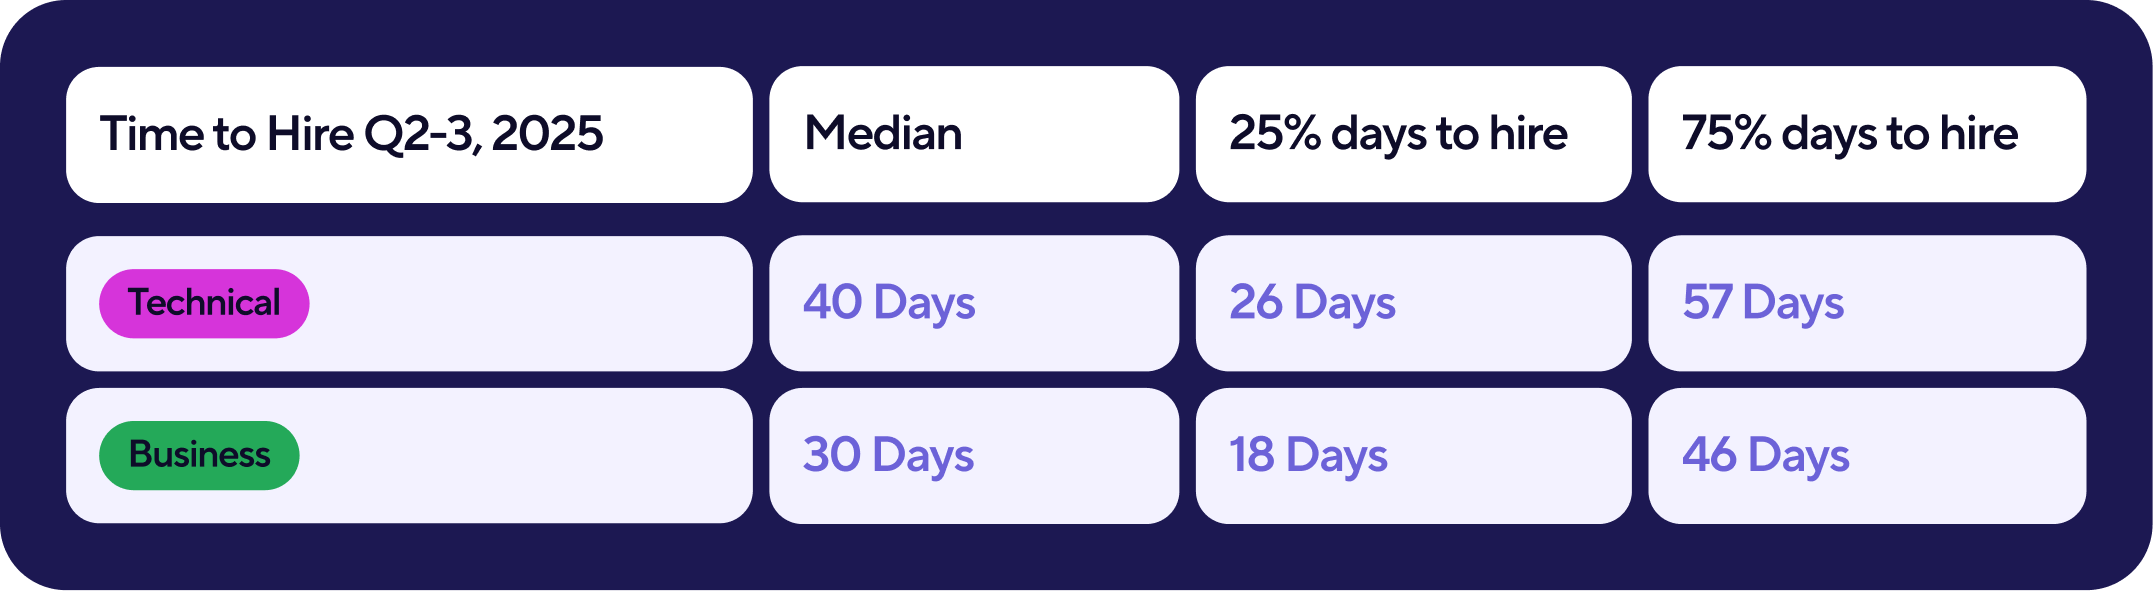
Time to Hire is consistently longer for technical roles than business roles
Looking at Time to Hire, the gap between business and technical roles follows a familiar pattern. Technical roles take longer to close than business roles.
- Business roles have a median of 30 days to hire, with 75% of roles closing within 46 days.
- Technical roles have a median of 40 days to hire, 75% averaging 57 days.
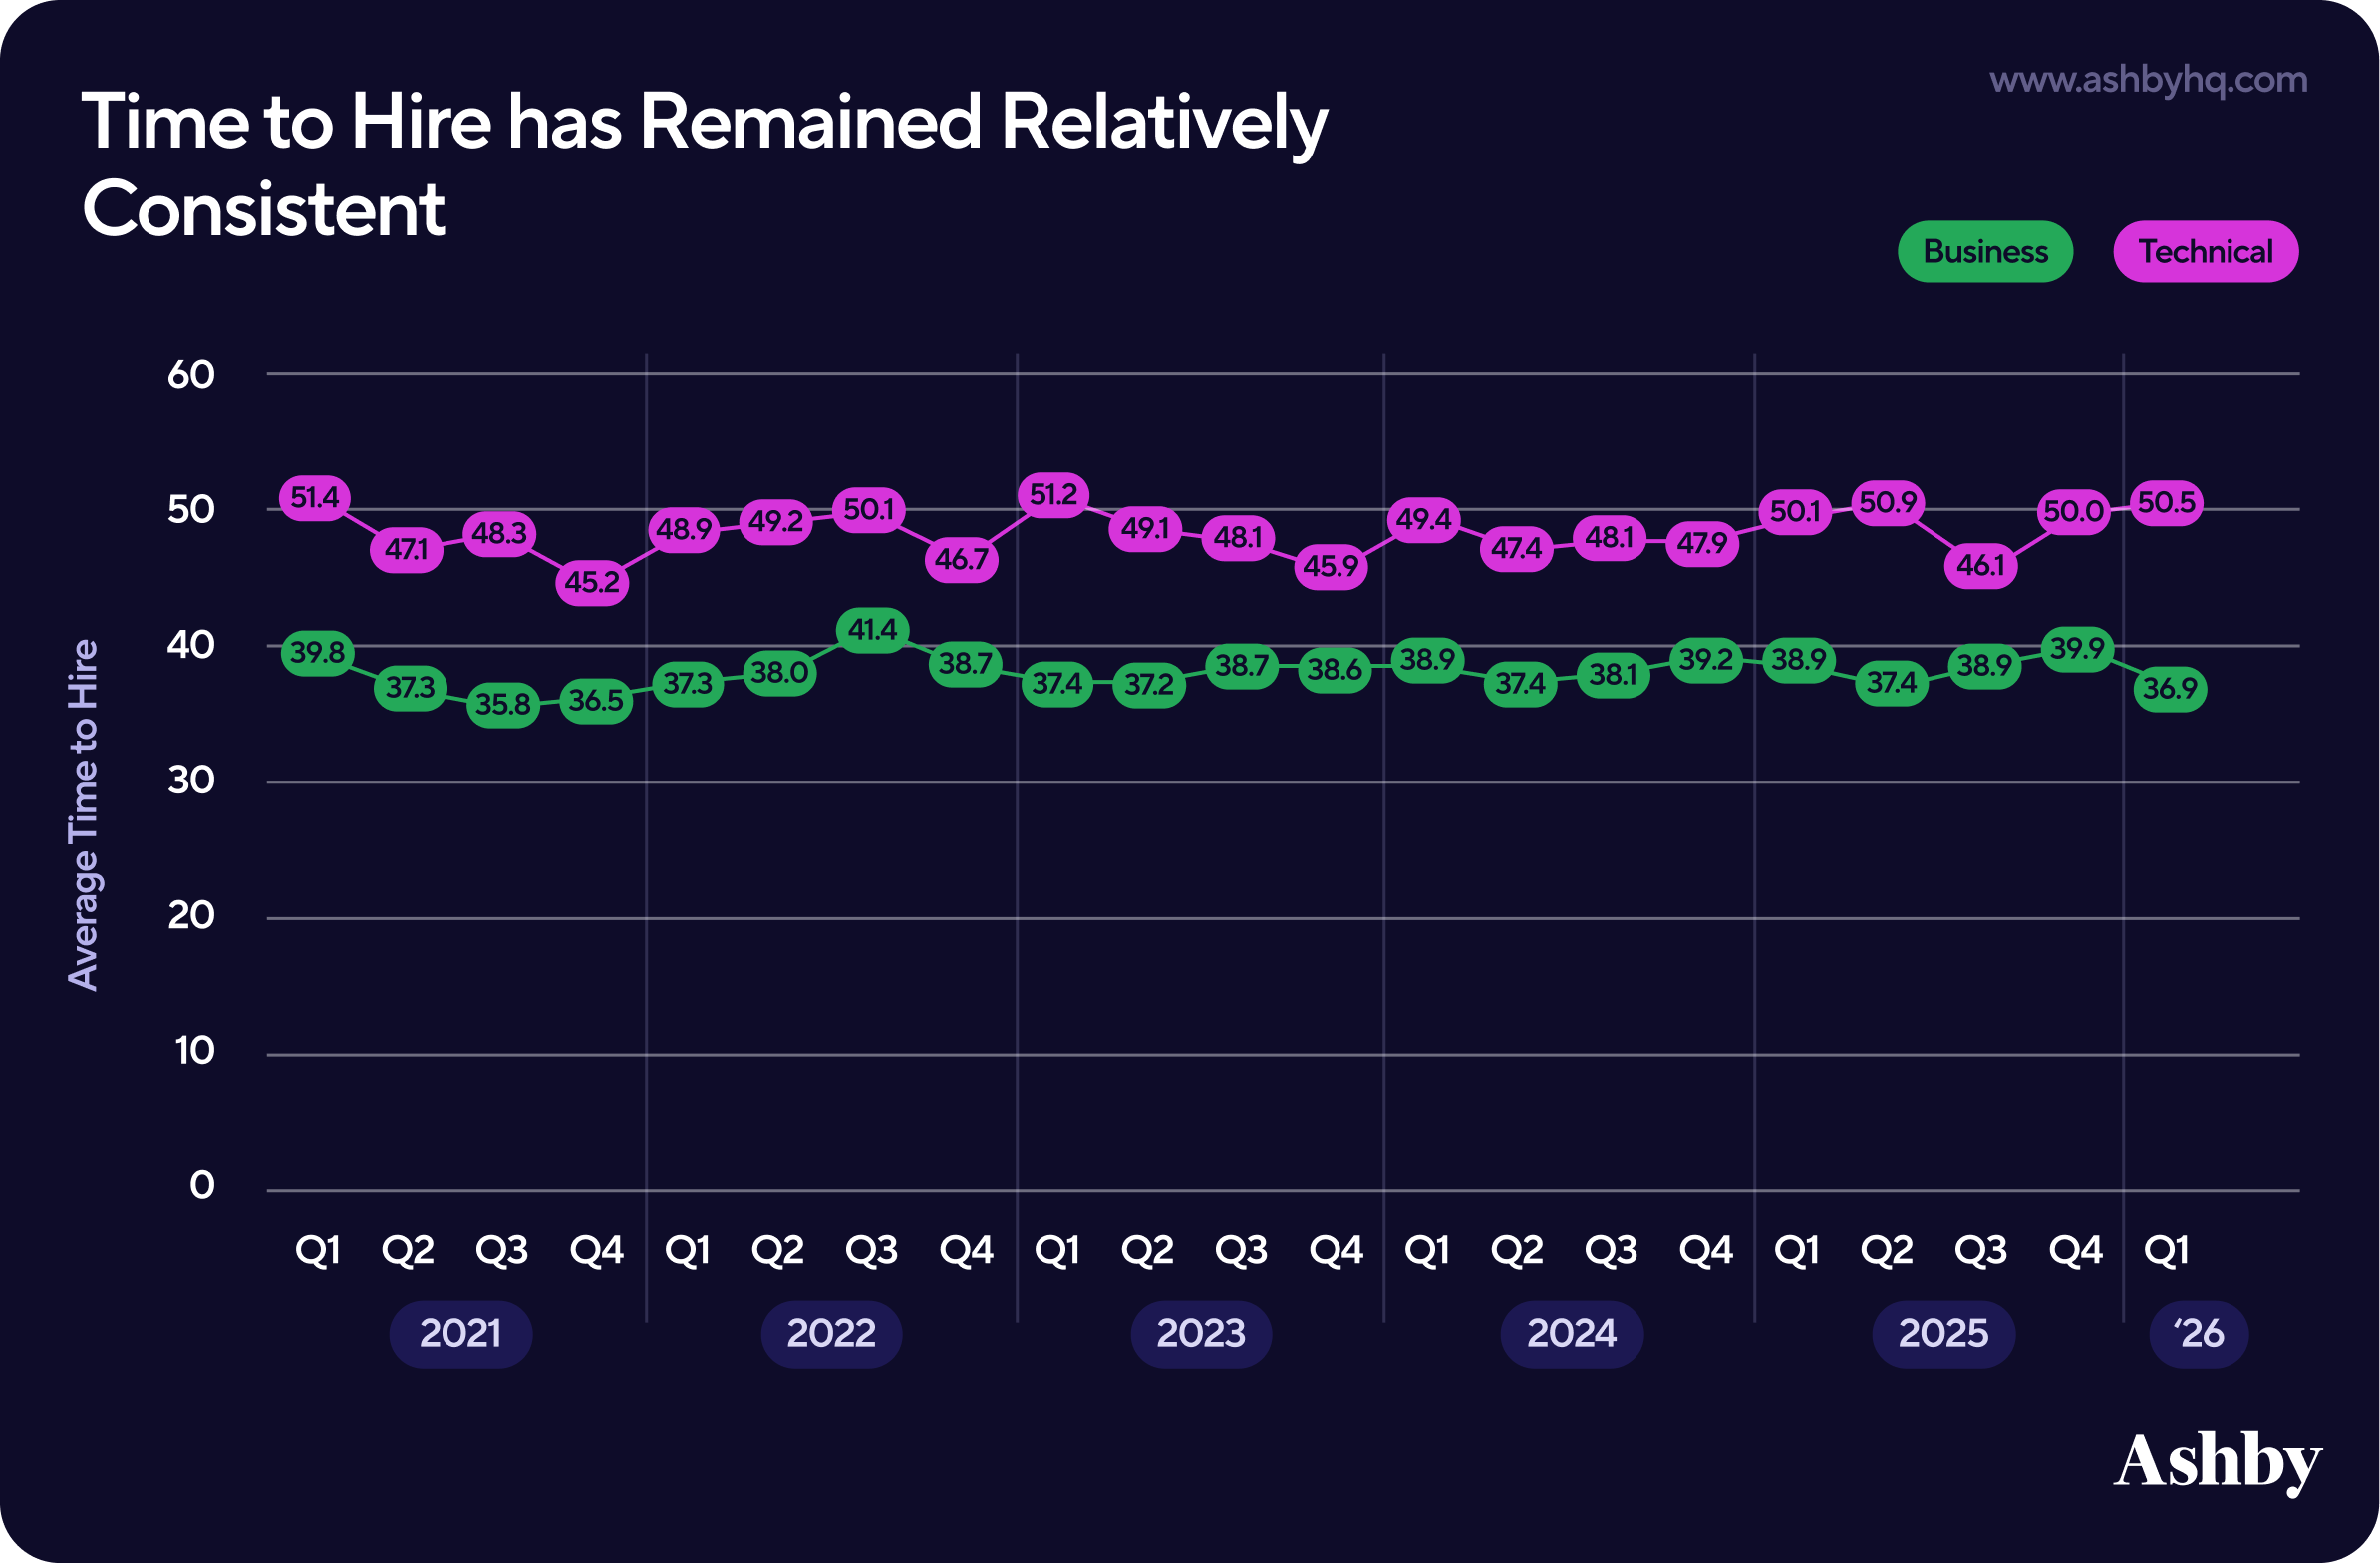
Time to Hire has remained consistent
Time to hire, measured from application to accepted offer, tells a similar story of stability.
- Technical roles average approximately 48 days from application to offer.
- Business roles average approximately 38 days from application to offer.
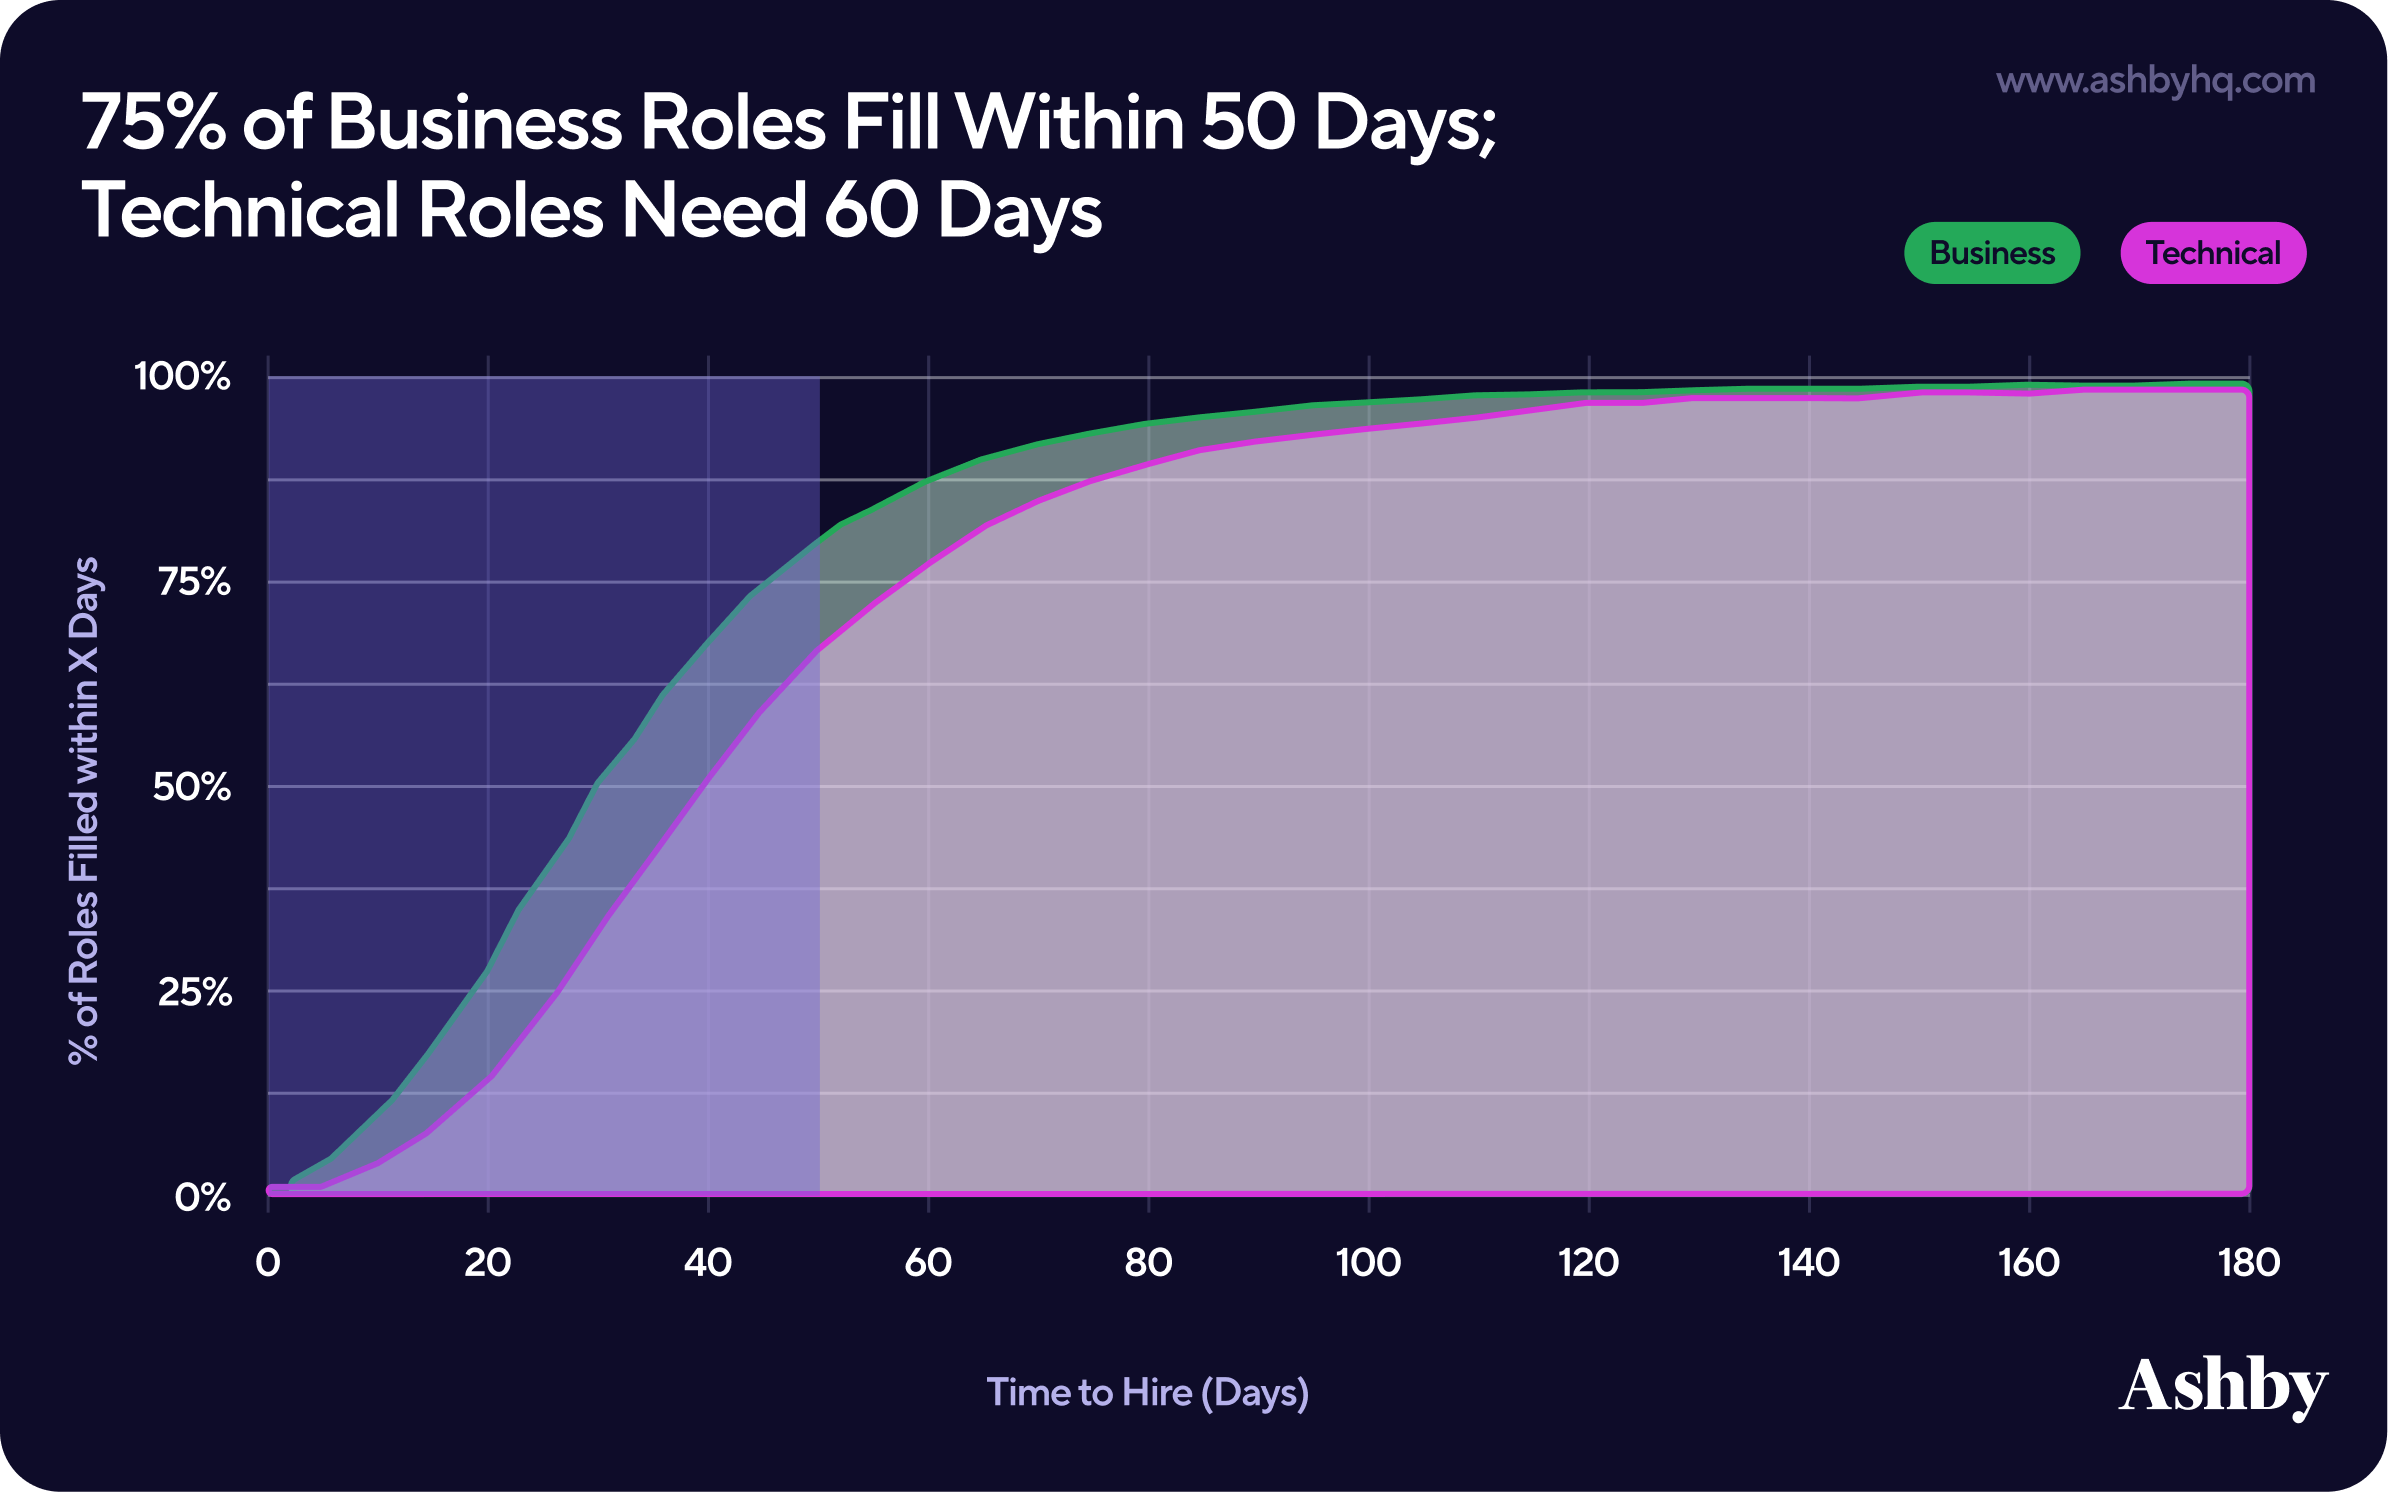
Business roles reach first hire faster than technical roles
The distribution matters as much as the average here. For business roles, 75% of hires happen within 50 days. For technical roles, that same threshold is 60 days. Two weeks in, business roles are twice as likely to have resulted in a hire compared to technical roles. This gives hiring managers a useful frame for setting expectations from the moment a role opens.
To close out our analysis, we took a look at where hired candidates are actually coming from.
Part 5: Sourcing and Candidate Origin
We previously analyzed accepted offers by source, seeing that more and more hires are made from direct applicants. As we extended the time series for this report, that trend still stands.
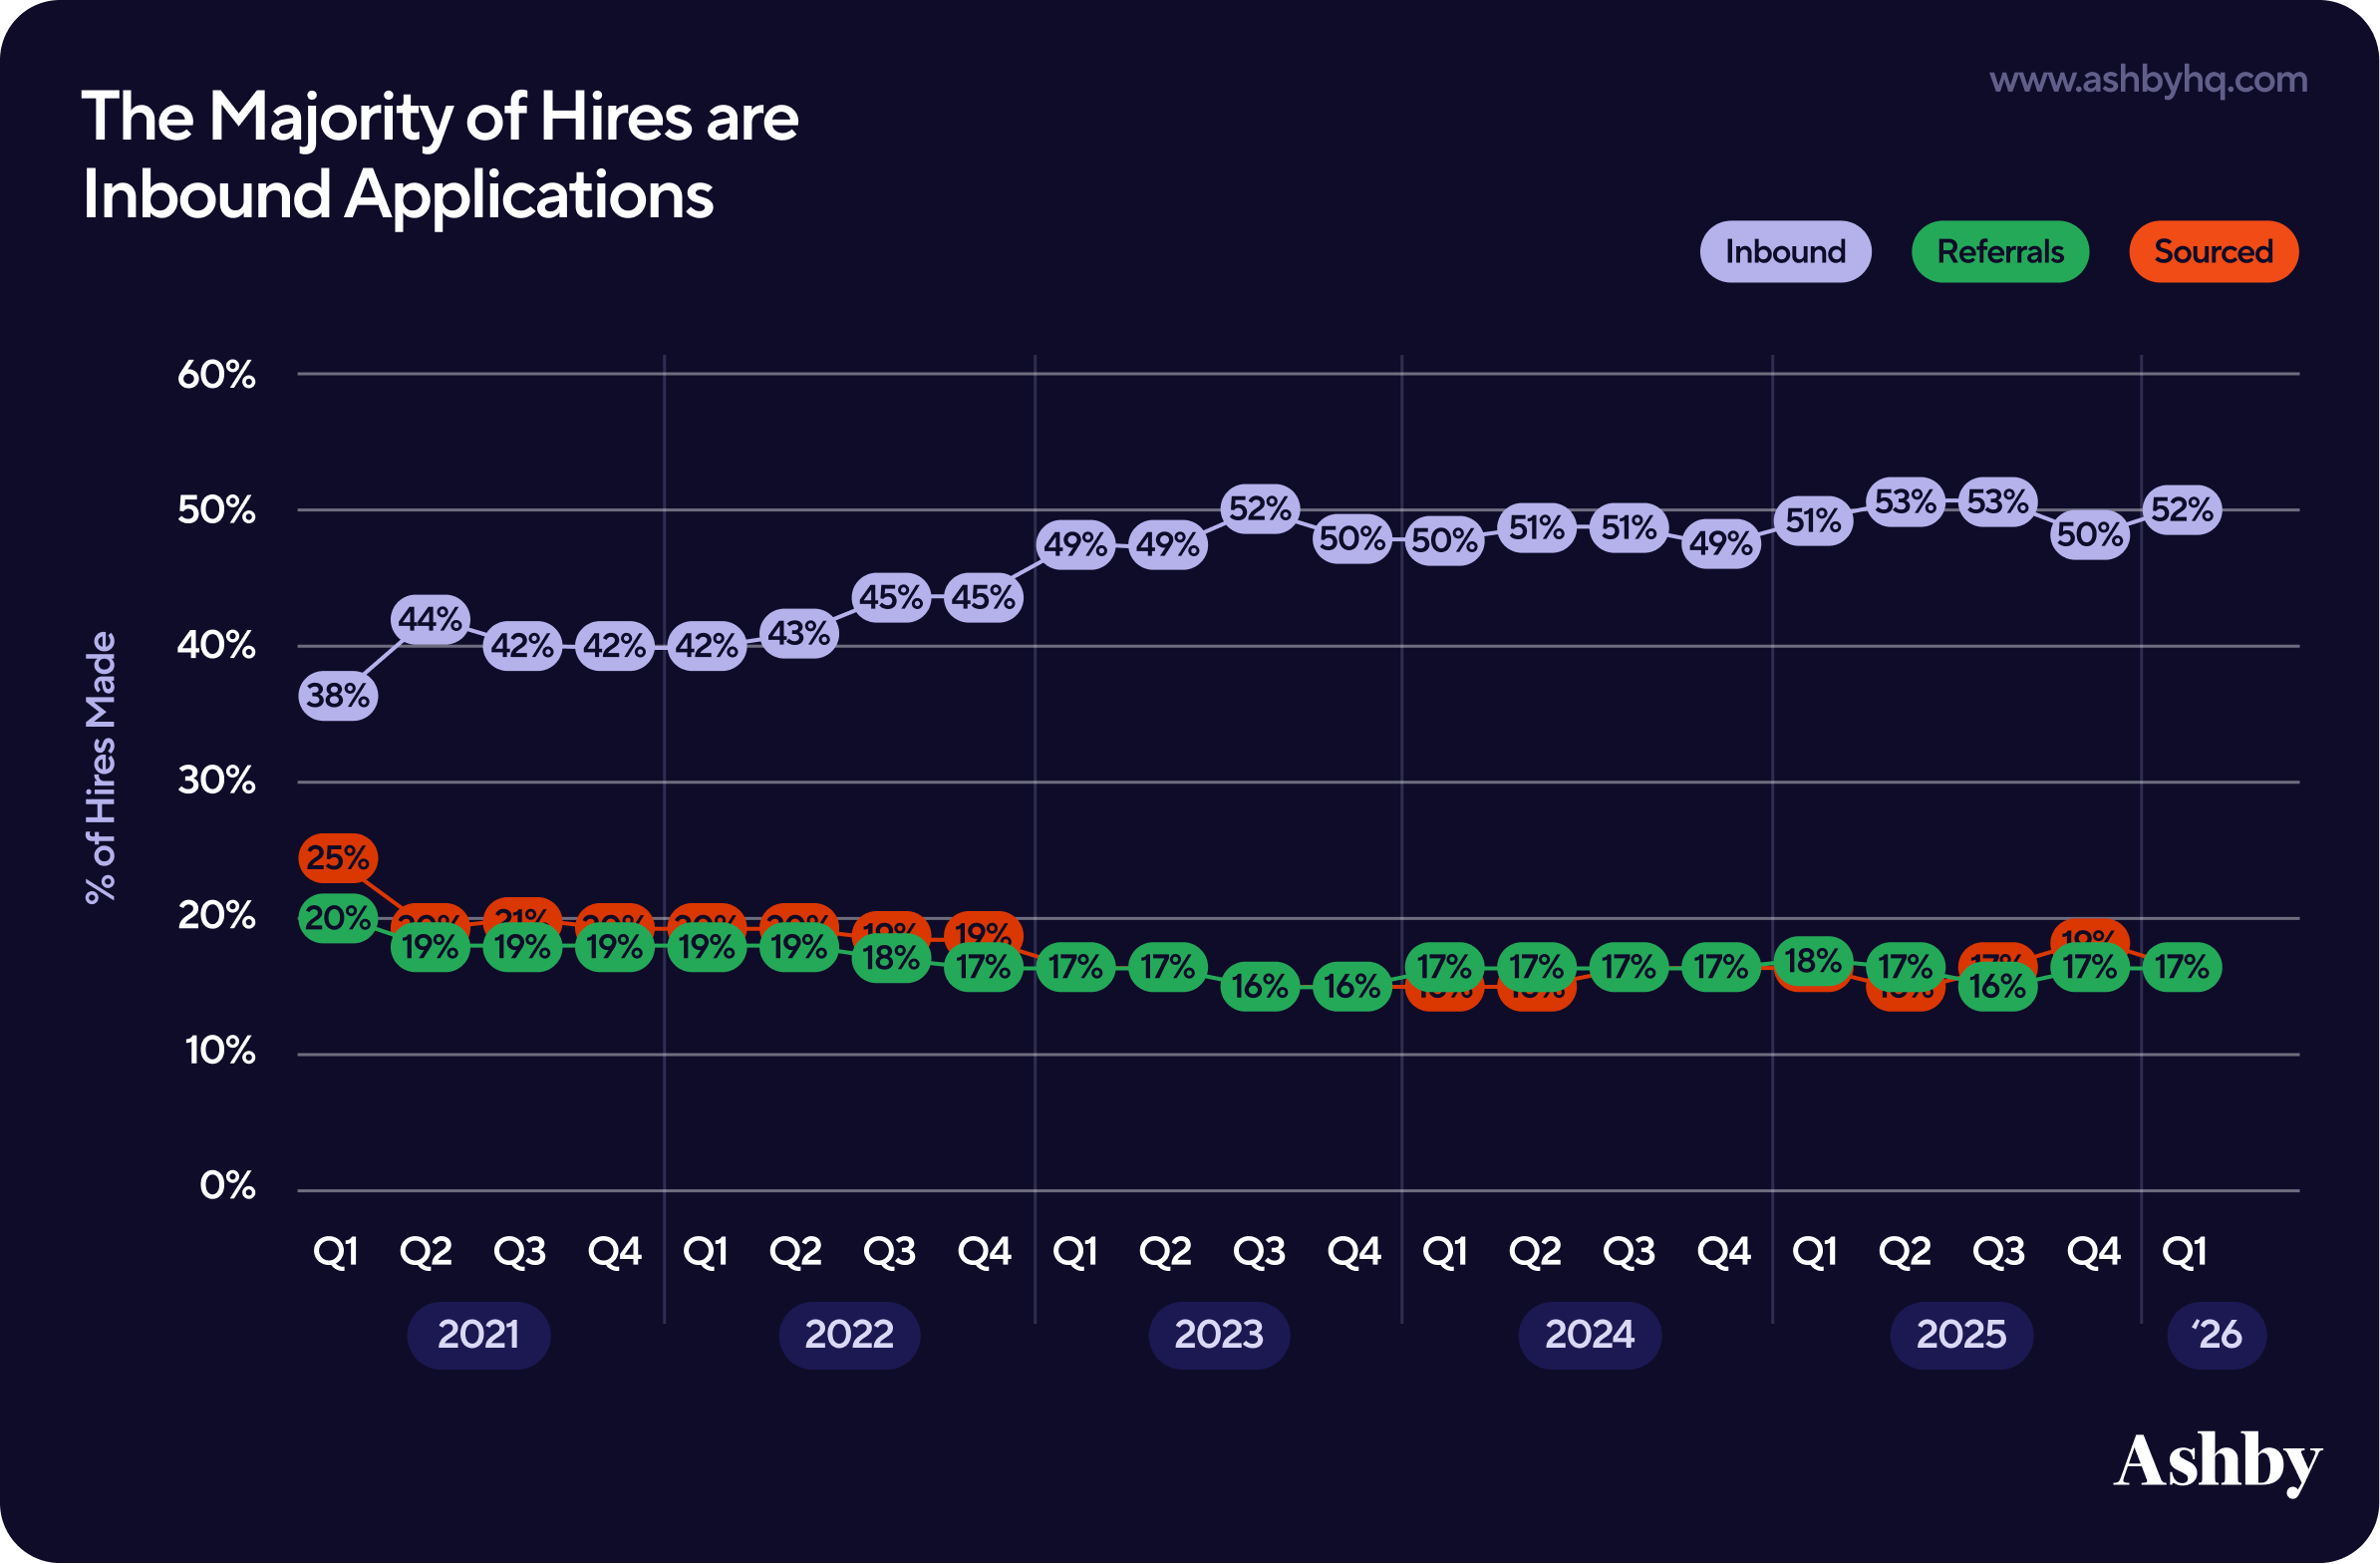
The majority of hires are inbound applications
- Inbound has accounted for more than 50% of all hires since Q1 2023.
- By Q1 2026, inbound accounts for 52% of all hires, up from 38% in early 2021.
- Sourced and referral hires have both declined as a share of total hires over the same period.
When application volumes were lower, sourcing and referrals carried more of the hiring load. Today, the inbound pipeline is deep enough that teams are making the majority of their hires from candidates who come to them directly.
Note: All other source categories were excluded from this chart for visual clarity, but the remaining 14% of hires come from sources such as agencies and internal transfers. For a closer look at various sources of hires, refer to this chart in our Office Acceptance Rates Report .
Conclusions
Through analyzing over 109M applications and 247K jobs from January 2021 through March 2026, we ultimately found:
- High-Volume Baseline: Applications per Hire tripled from 2021 to 2024 and remained above 300 throughout 2025. Even as volume begins to moderate, this remains a clear signal of how much top-of-funnel volume has shifted.
- Recruiter Resilience: Despite the volume surge, Hires per Recruiter have recovered from 2023 lows, with the average recruiter reaching ~7 hires per quarter.
- Stronger Conversion Rates: Candidates who reach the interview stage are converting to offers at rates that surpass the 2021 levels. Teams are interviewing fewer candidates as a fraction of all applications, and candidates who receive an interview are more likely to be the right fit.
- The Interview Intensity Gap: Technical hiring remains significantly more resource-intensive, averaging nearly twice the interview hours and one additional interview event compared to business roles.
- Stabilized Timelines: Time to First Fill has settled at 8 weeks for business roles and 10 weeks for technical roles, suggesting a return to predictable hiring cycles.
For hired candidates, the interview experience itself has remained largely unchanged, as they have the same number of interviews and the same amount of time spent. The increased burden has landed primarily on recruiting teams.
In response, organizations are increasingly turning to technology to help recruiters keep pace. Ashby brings together ATS, scheduling, CRM, and AI-assisted application review in one platform, giving teams what they need to manage higher volume without sacrificing hiring quality.
For more recruiting insights and benchmarks, subscribe to our Talent Trends newsletter.
Other Reports

2023 Trends Report | Applications Per Job
Analyzing 13 million applications from January 2021 - April 2023 to surface key patterns around applications per job per week.

Recruiting Operations Benchmarks | 2026 Talent Trends Report
An analysis of 54M applications and 93K jobs globally across Ashby customers from January 2021 through March 2026 provides a Recruiting Operations perspective on hiring performance.

Subscribe for more talent trends and insights
We will be regularly releasing new reports around trends and insights we're seeing in our data and you will be the first to know.