Offer Acceptance Rates | Talent Trends Report

19 minute read
Topics
Table Of Contents
Every step in the hiring process leads to one desired outcome: a candidate accepting your offer. Though when it comes to benchmarking offer acceptance (and other important recruitment metrics), we found few resources. Our recurring Talent Trends Reports seek to provide talent acquisition teams and hiring managers alike with context for internal goal setting.
This report analyzes 230K applications that reached the offer stage from January 2021 through March 2024 to benchmark Offer Acceptance Rate (OAR) by function, industry, and more. Click here to download a PDF copy instead.
How We Looked at OAR
We calculate the Offer Acceptance Rate based on candidates entering the offer stage and evaluating their final outcome. Our analysis takes this approach to control for bias related to when teams are more likely to create or to not create official offers in their applicant tracking system (ATS). For example, some teams tend to create offers only after verbal acceptance. We additionally control for organization-based rejection reasons to identify what we believe is the most accurate measure of a candidate's decision to accept or reject an offer.
Report Highlights
We found a number of interesting trends in this report. A peek at a few high level trends includes:
- 2023 exhibited the highest average Offer Acceptance Rate for the years we’ve analyzed to date at 81%.
- Time in Offer Stage dipped 16% in Q3 2023, from an average of ~3 days to an average of ~2.5 days. This likely reflects the eagerness of candidates to find a new role in recent months.
- We observe a peak in more rejections coming from the organization versus the candidate from Q4 2022 to Q3 2023. This time period again aligns with the general withdrawal of headcount and rescinding of roles we’ve heard shared qualitatively across LinkedIn.
Let’s explore all the data in further detail.
Offer Acceptance Rate Benchmarks
Any talent acquisition leader who has gone through a few recruiting cycles expects Offer Acceptance Rates to fluctuate, especially when there are critical market events. Looking quarter by quarter, this intuition seems to match the fluctuations in OAR observed.
We can see in the chart below how offers accepted dipped slightly in an environment of increased job offer volume. This is seen most clearly in the time period between Q4 2021 and Q2 2022 when offer volume was high before the mass tech layoffs began to impact role availability.
Across the three year period, we observe an average Offer Acceptance Rate of 78%. [Tweet This]
Looking at this same data by calendar year, we see a:
- 77% Offer Acceptance Rate in 2021
- 76% Offer Acceptance Rate in 2022
- 81% Offer Acceptance Rate in 2023
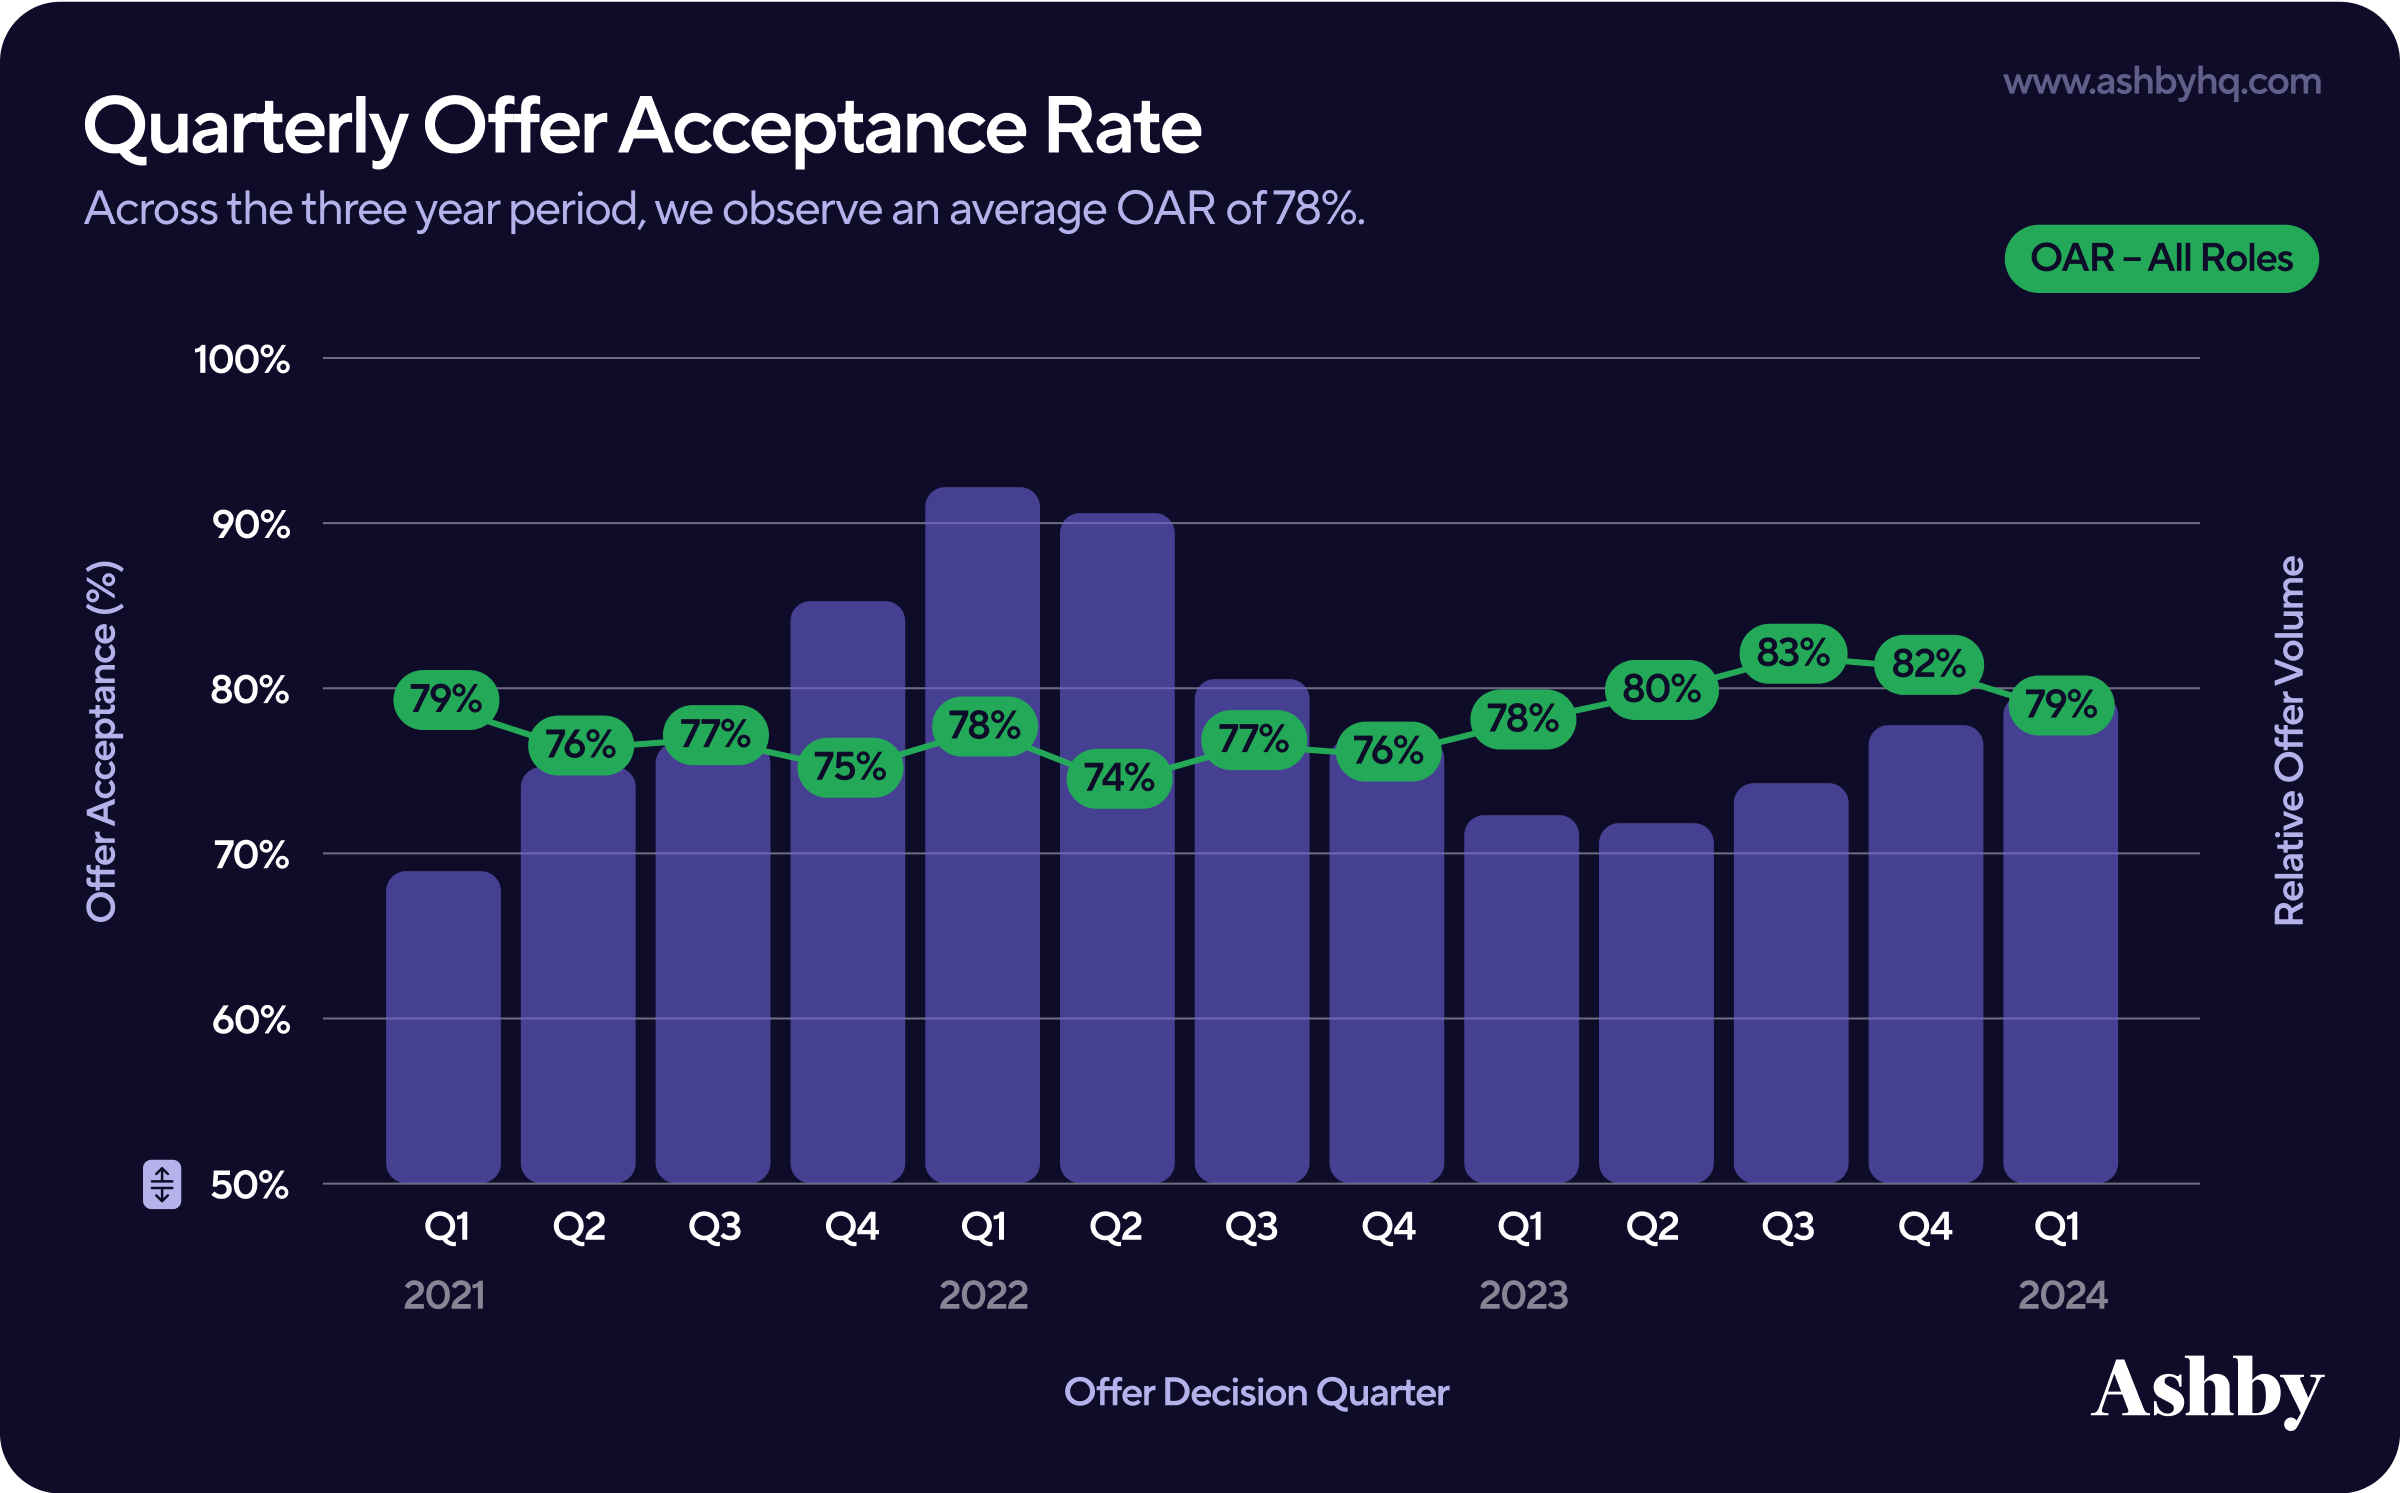
As the total number of roles began dwindling, we saw a high Offer Acceptance Rate take form — particularly in the last two quarters of 2023. The 2023 job Offer Acceptance Rate of 81% is the highest in years we’ve analyzed to date. [Click to Tweet]
Anecdotally on social media, many job seekers shared difficulty finding roles during this time, which could influence willingness to accept a job offer.
In speaking with customers, we’ve also heard that a number of quality candidates already in a role were more hesitant to interview and switch to another company during periods of widespread layoffs. This shifted more pressure onto hiring teams to help top talent understand the stability and growth of your organization in order to fill open roles.
Offer Acceptance Rate by Function
In filtering the data by technical and business functions, we found that the latter have 11 percentage points higher Offer Acceptance Rates — even during layoff seasons. Across the three years, we observe a:
- 73% average Offer Acceptance Rate for technical roles
- 84% average Offer Acceptance Rate for business roles
The gap between these two functions was most prominent from Q2 2021 to Q2 2022 – when the number of offers overall was also increasing (as seen in the previous chart). It is less clear why this gap widened, especially when considering both functions were impacted heavily by mass layoffs.
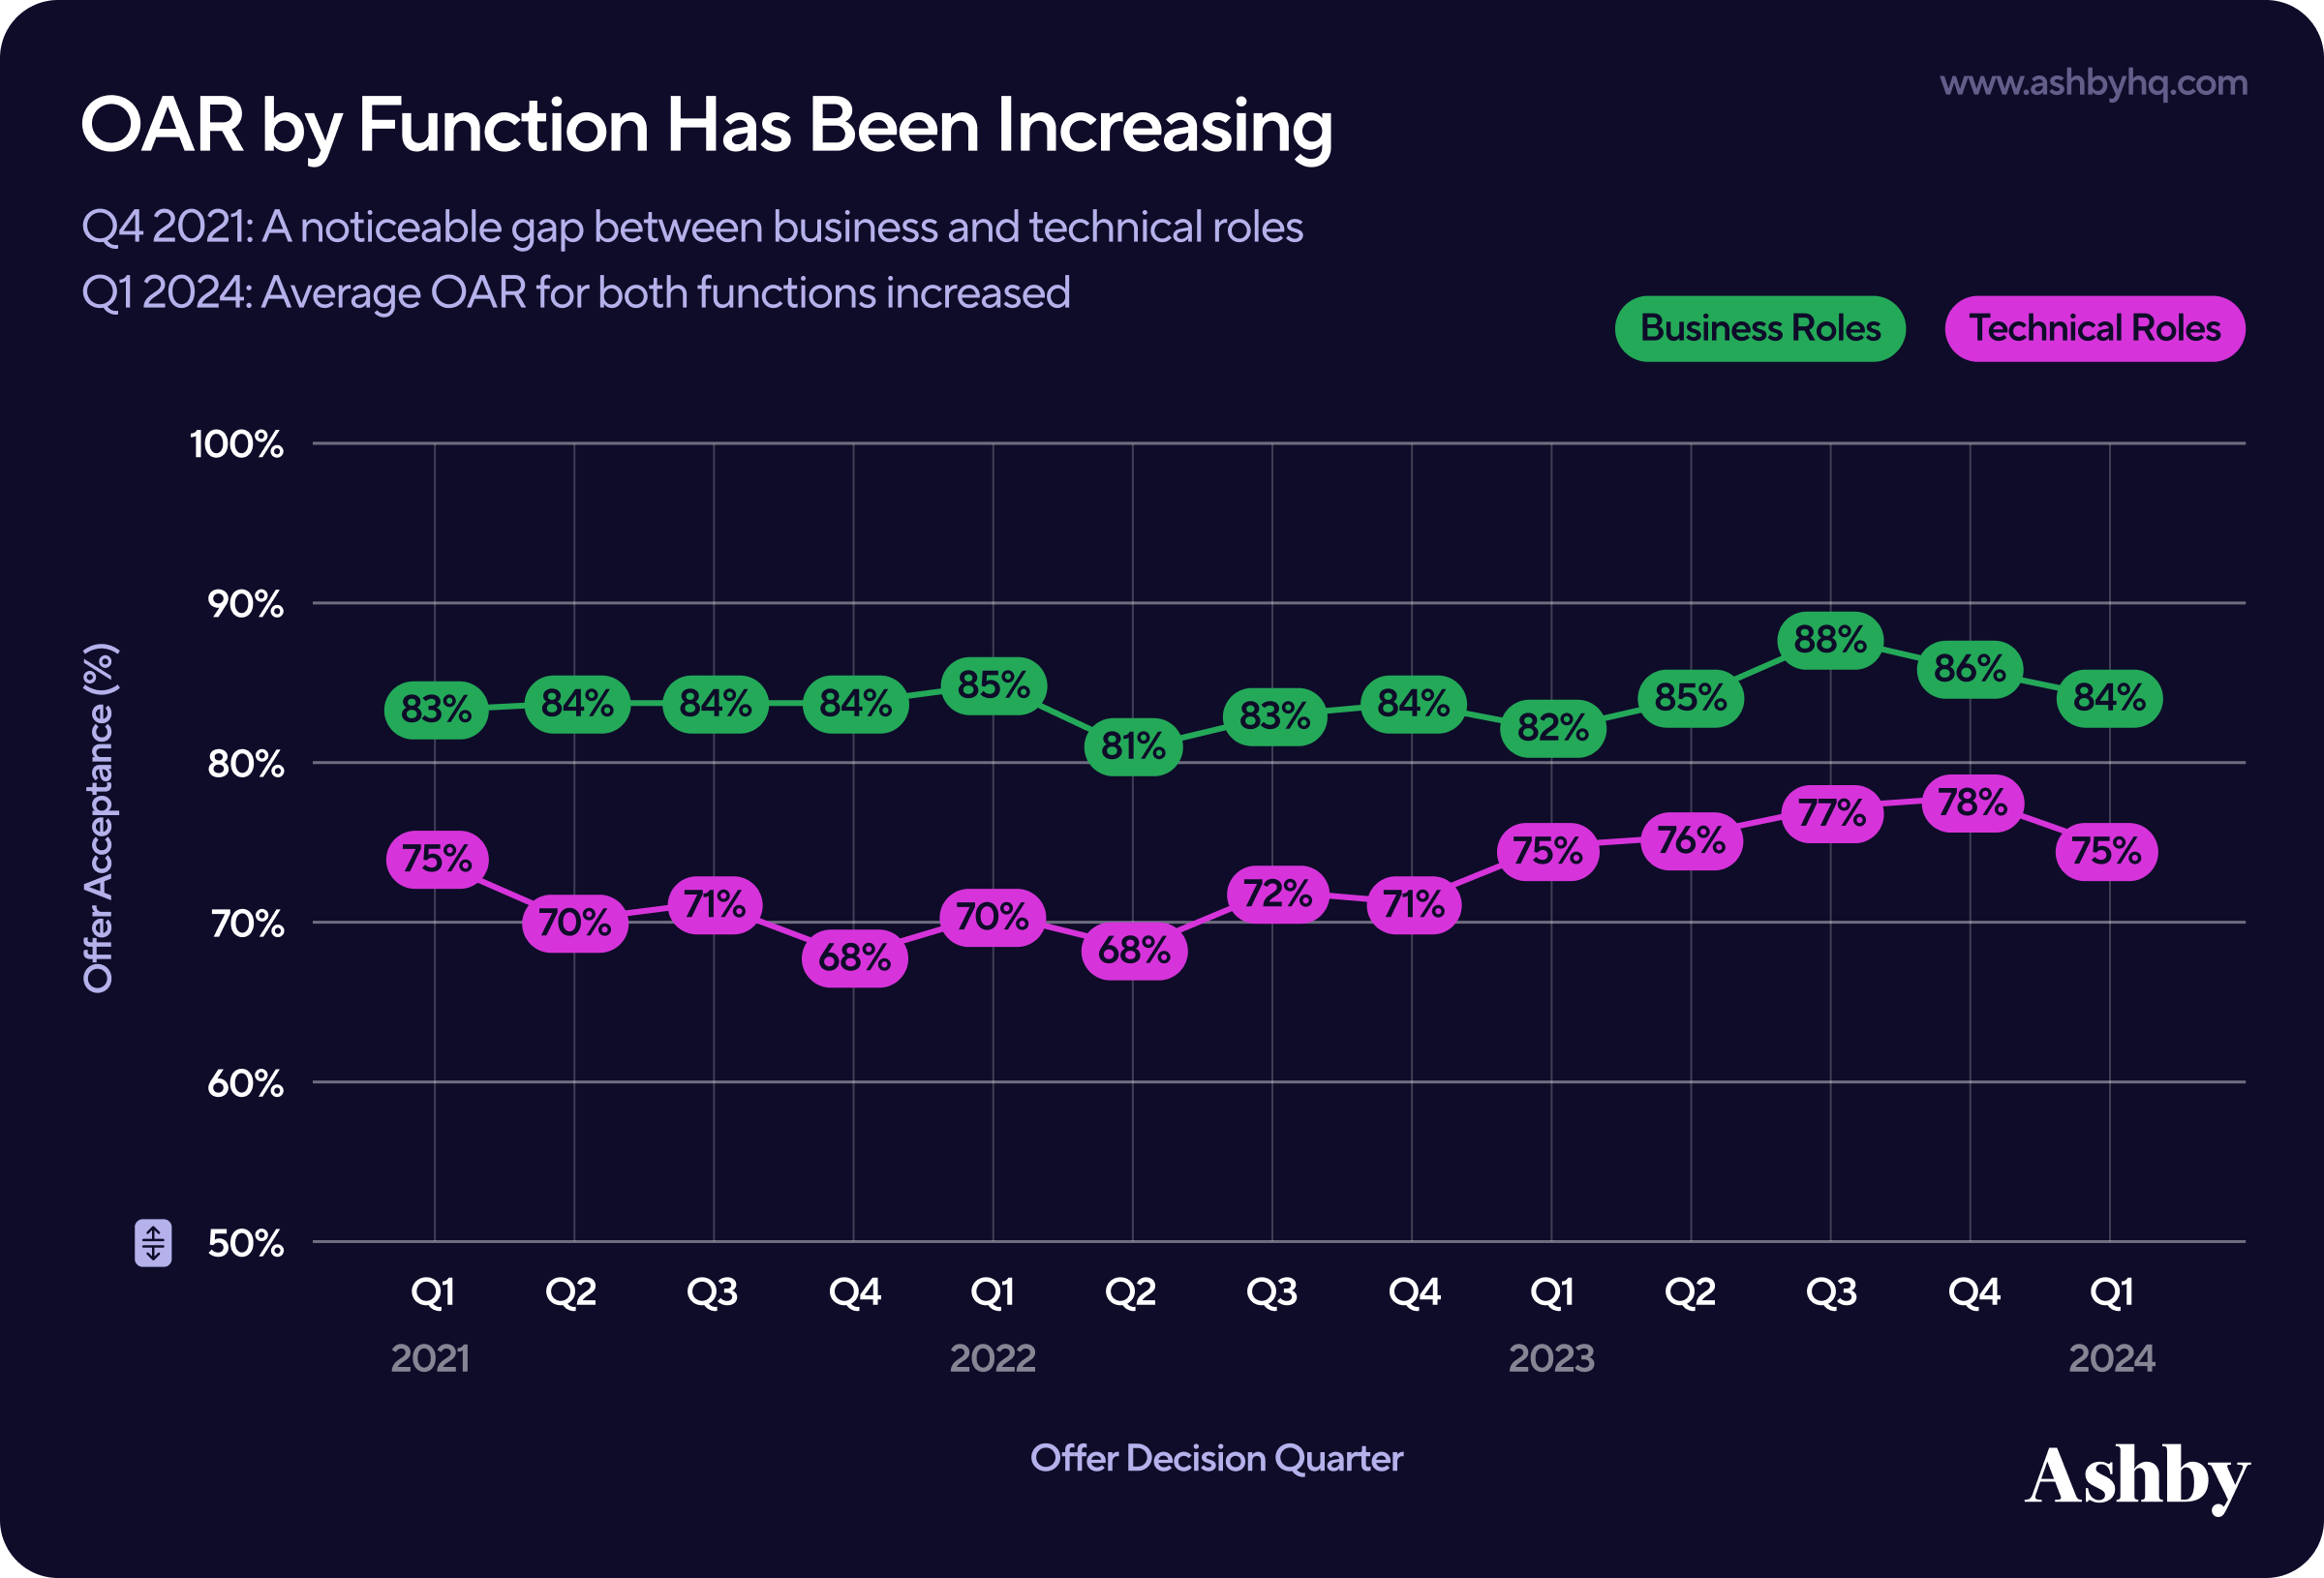
What is clearer, however, is that a consistently lower Offer Acceptance Rate for technical job seekers means these candidates evaluate and approach roles differently.
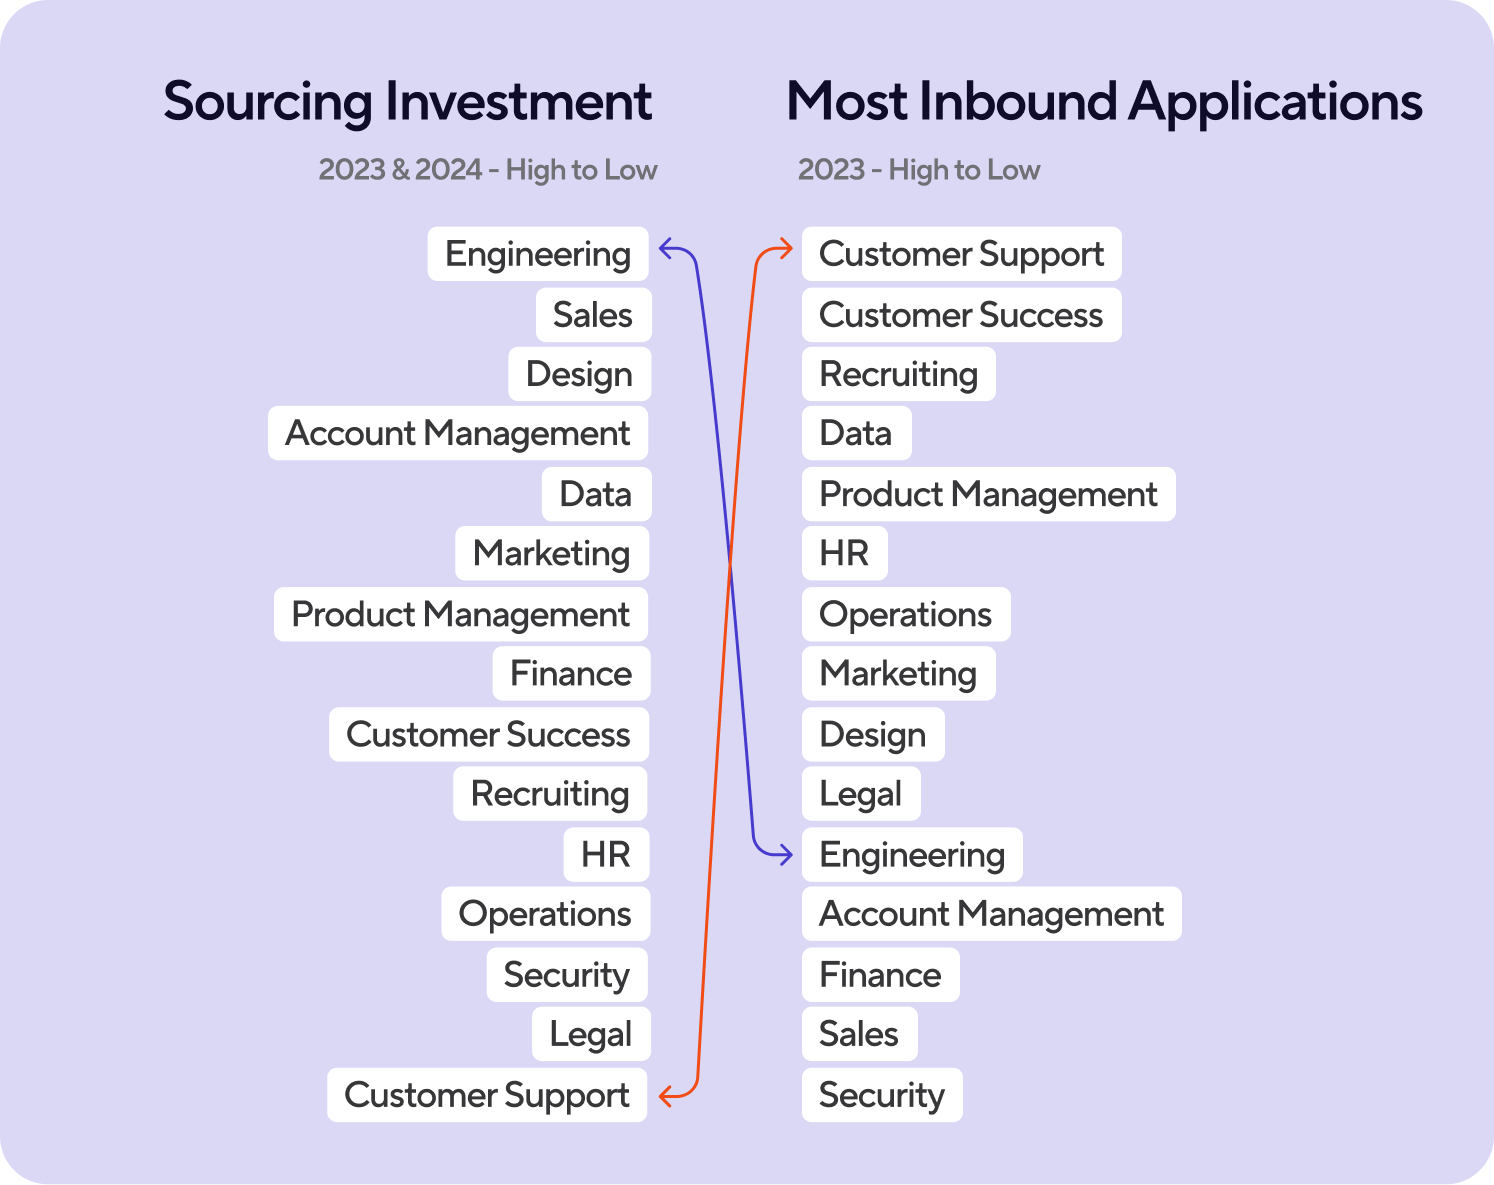
Our Candidate Sourcing report gives some insight into just one of the ways the technical candidates’ expectations differ: In that report, we found Engineering candidates are far less likely to open an outbound sourcing campaign in comparison to other role types. Still, Engineering roles continue to see some of the highest volumes of sourcing, often in attempts to get noticed by top talent.
Offer Acceptance Rate by Industry
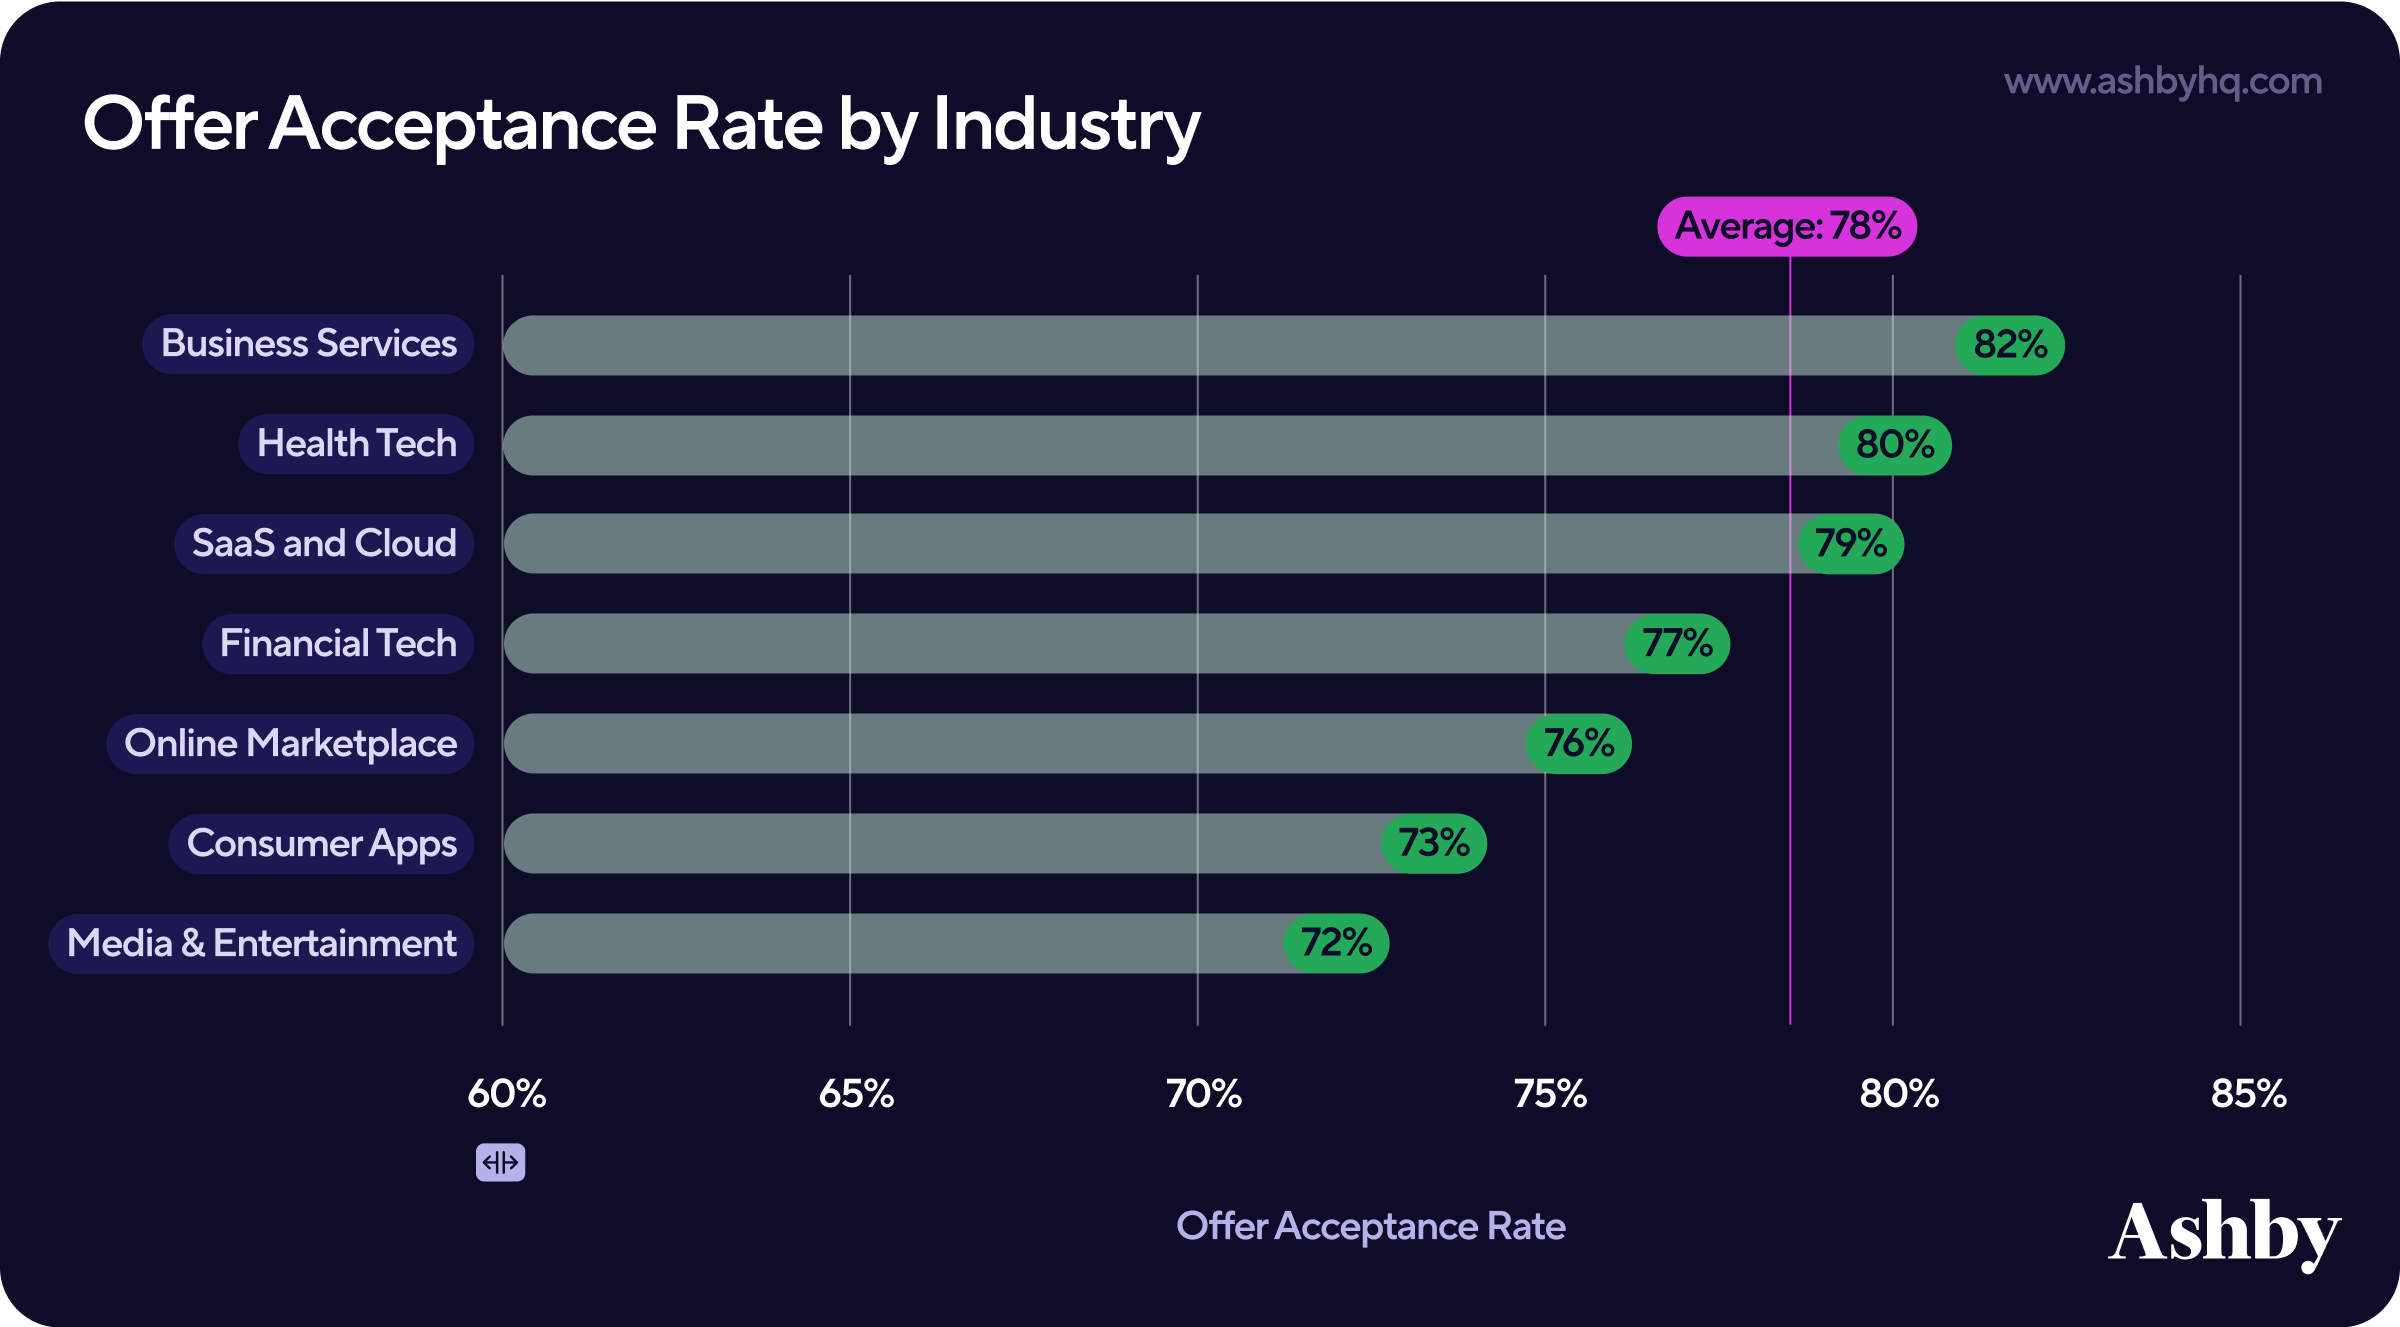
When we bucketed this recruiting metric by industry, we found only small differences. This signaled to us that the role itself, job description, application process, and other factors likely have more weight than the industry the open role is in. In other words, a software engineering candidate generally has industry-agnostic skills, so their evaluation is focussed on the engineering role versus specific roles in FinTech vs HealthTech.
If still helpful to your recruitment strategy, the benchmarks here are:
- Business Services: 82%
- Health Technology: 80%
- Saas and Cloud: 79%
- Financial Technology: 77%
- Online Marketplaces: 76%
- Consumer Apps: 73%
- Media & Entertainment: 72%
Time In Offer Stage
In our analysis, Time in Offer Stage is based on the movement into and out of the Offer Stage. As is the nature of the hiring process, there are times when candidates are moved into and out of various stages (offer, hired, archived). This can result in errors entering data, rescinding offers, and so on. In such scenarios, we assessed from the last time a candidate is moved from an offer stage to a terminal stage — either hired or archived.
We immediately see that overall, Time in Offer was generally stable at 3 days until Q2 2023, at which point we observed a 16% drop to 2.5 days. [Tweet This]
It’s important to emphasize here that this is an average. If you are seeing performance outside of this — don’t be alarmed! For example, a candidate who is particularly enthusiastic about the company or role may accept faster. In other instances, there may be a candidate evaluating offers from multiple organizations who doesn’t respond to the offer for five days. All of this is accounted for in the average.
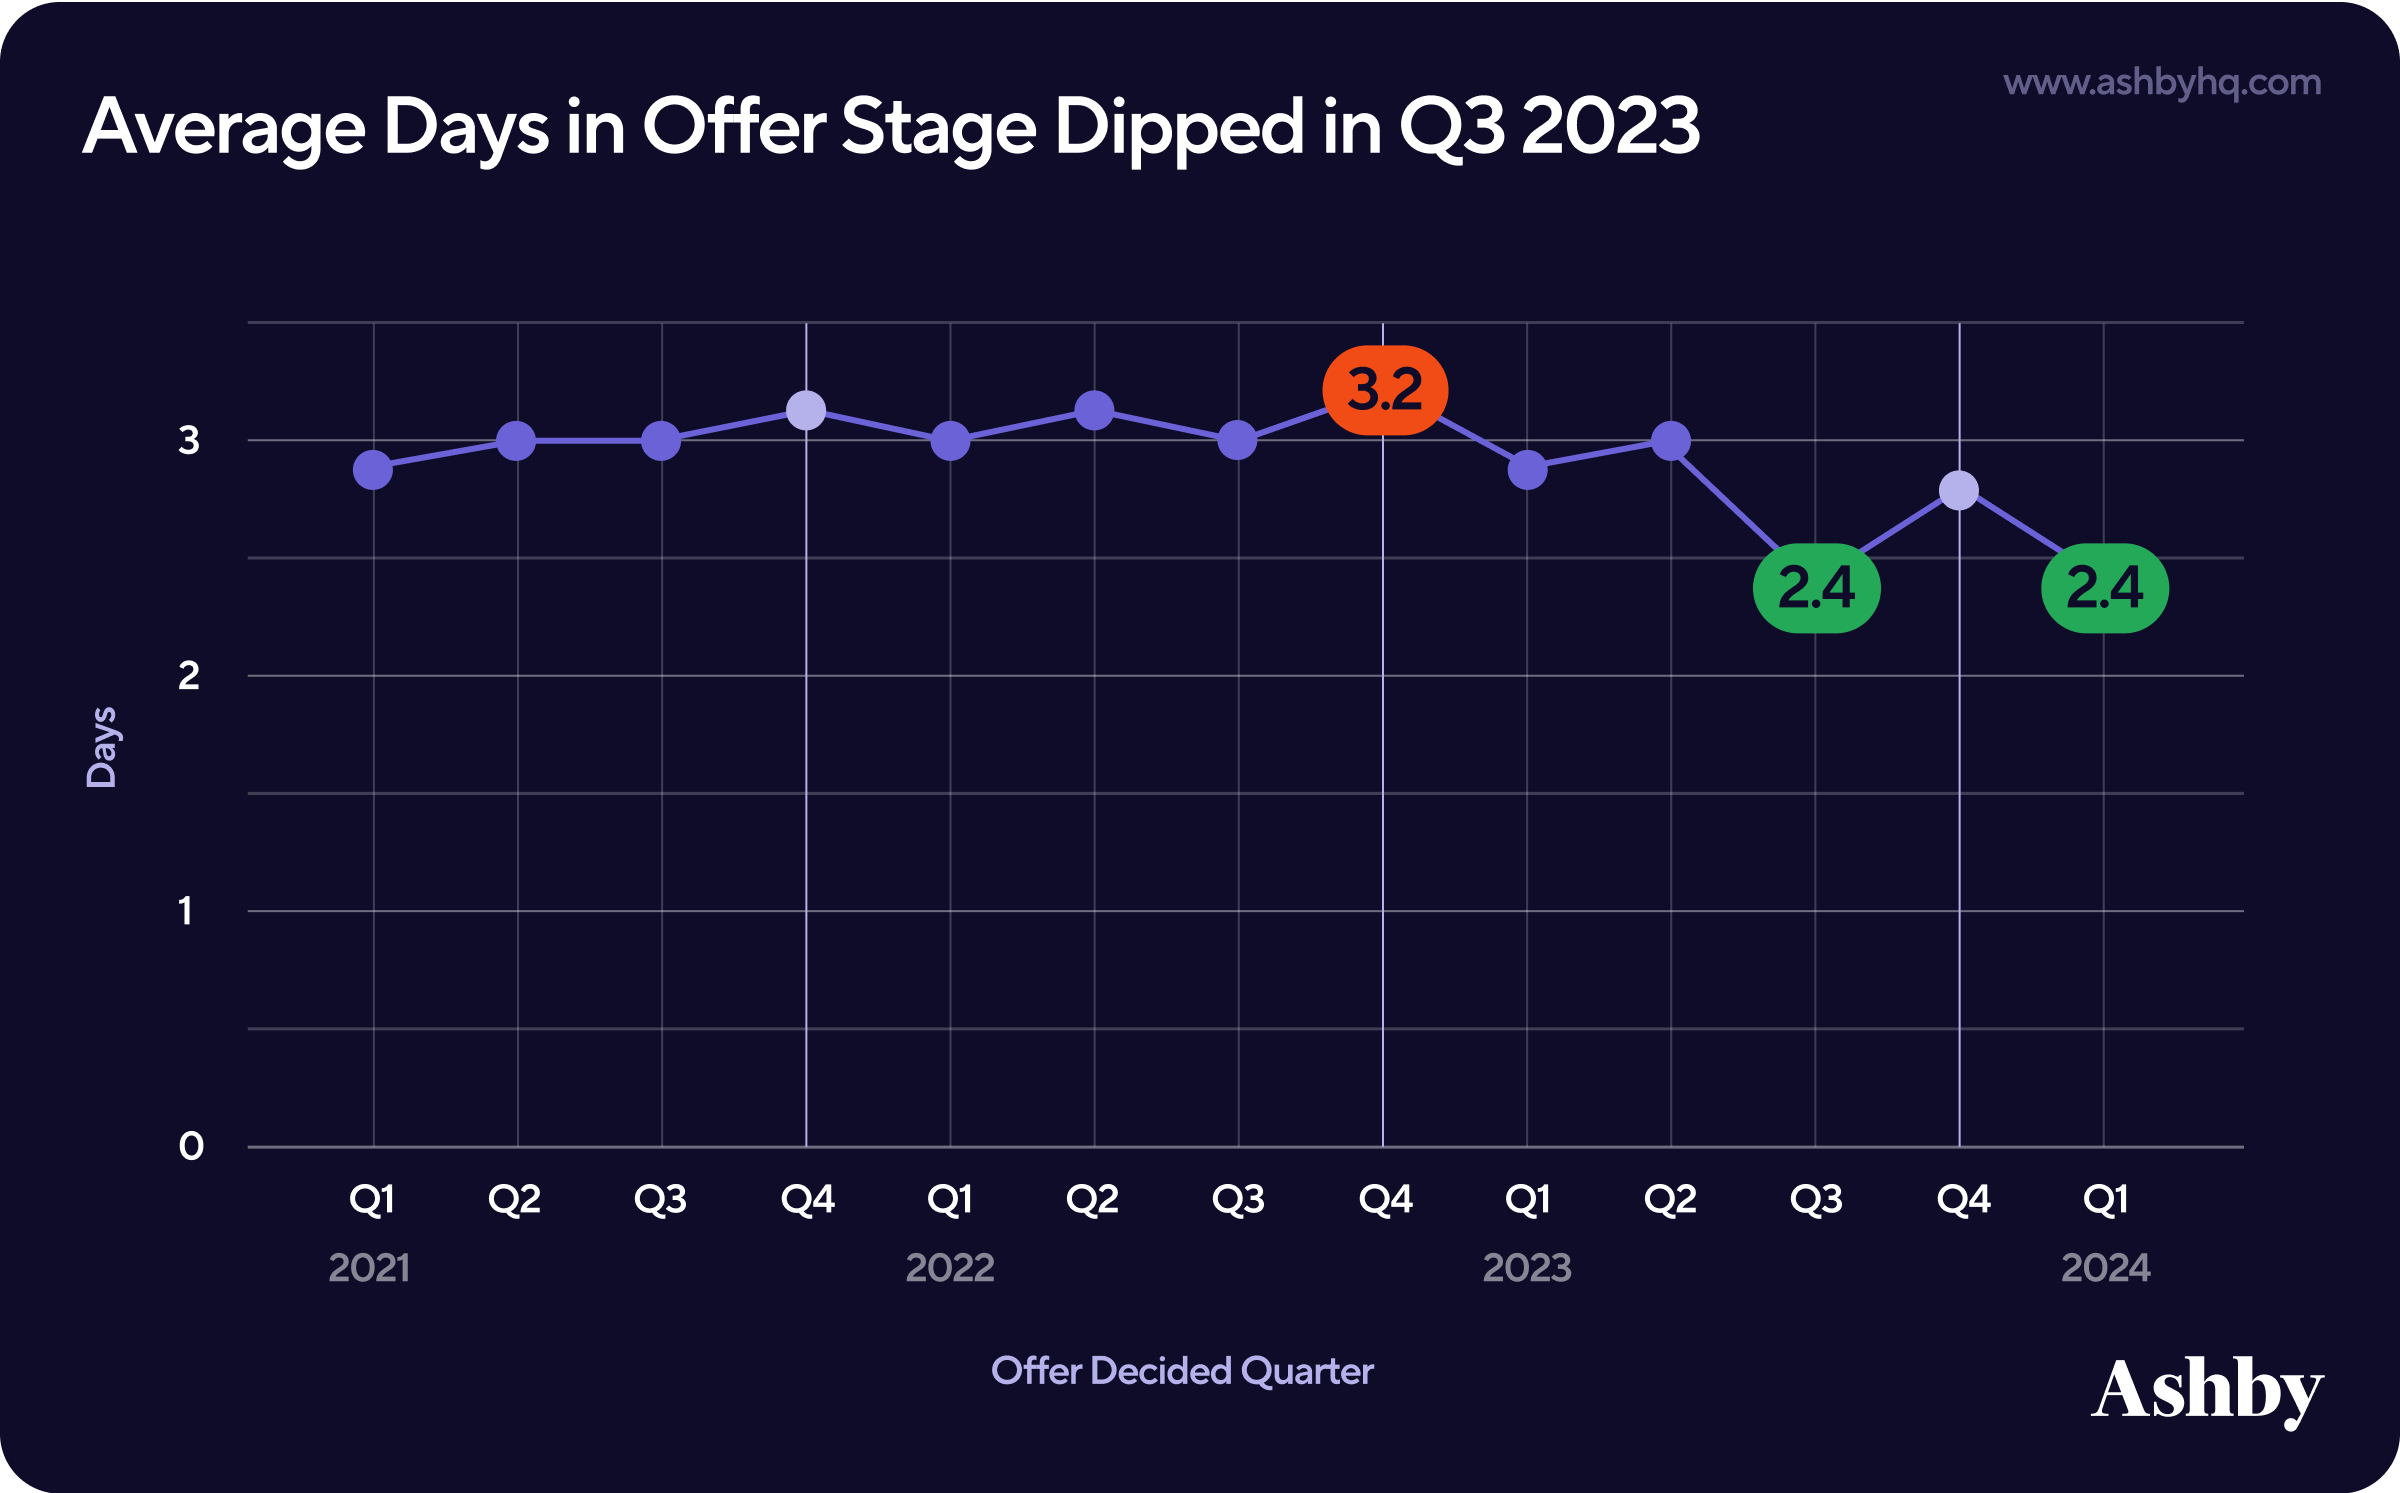
The downtick in time in more recent months corresponds with an uptick in average Offer Acceptance Rate. This story aligns with the overall narrative of a difficult market for landing a new role driving urgency and willingness to accept a role.
From our perspective, this data becomes most interesting when slicing it by whether or not the candidate accepts the extended offer.
Time in Offer Stage by Accepted vs Rejected
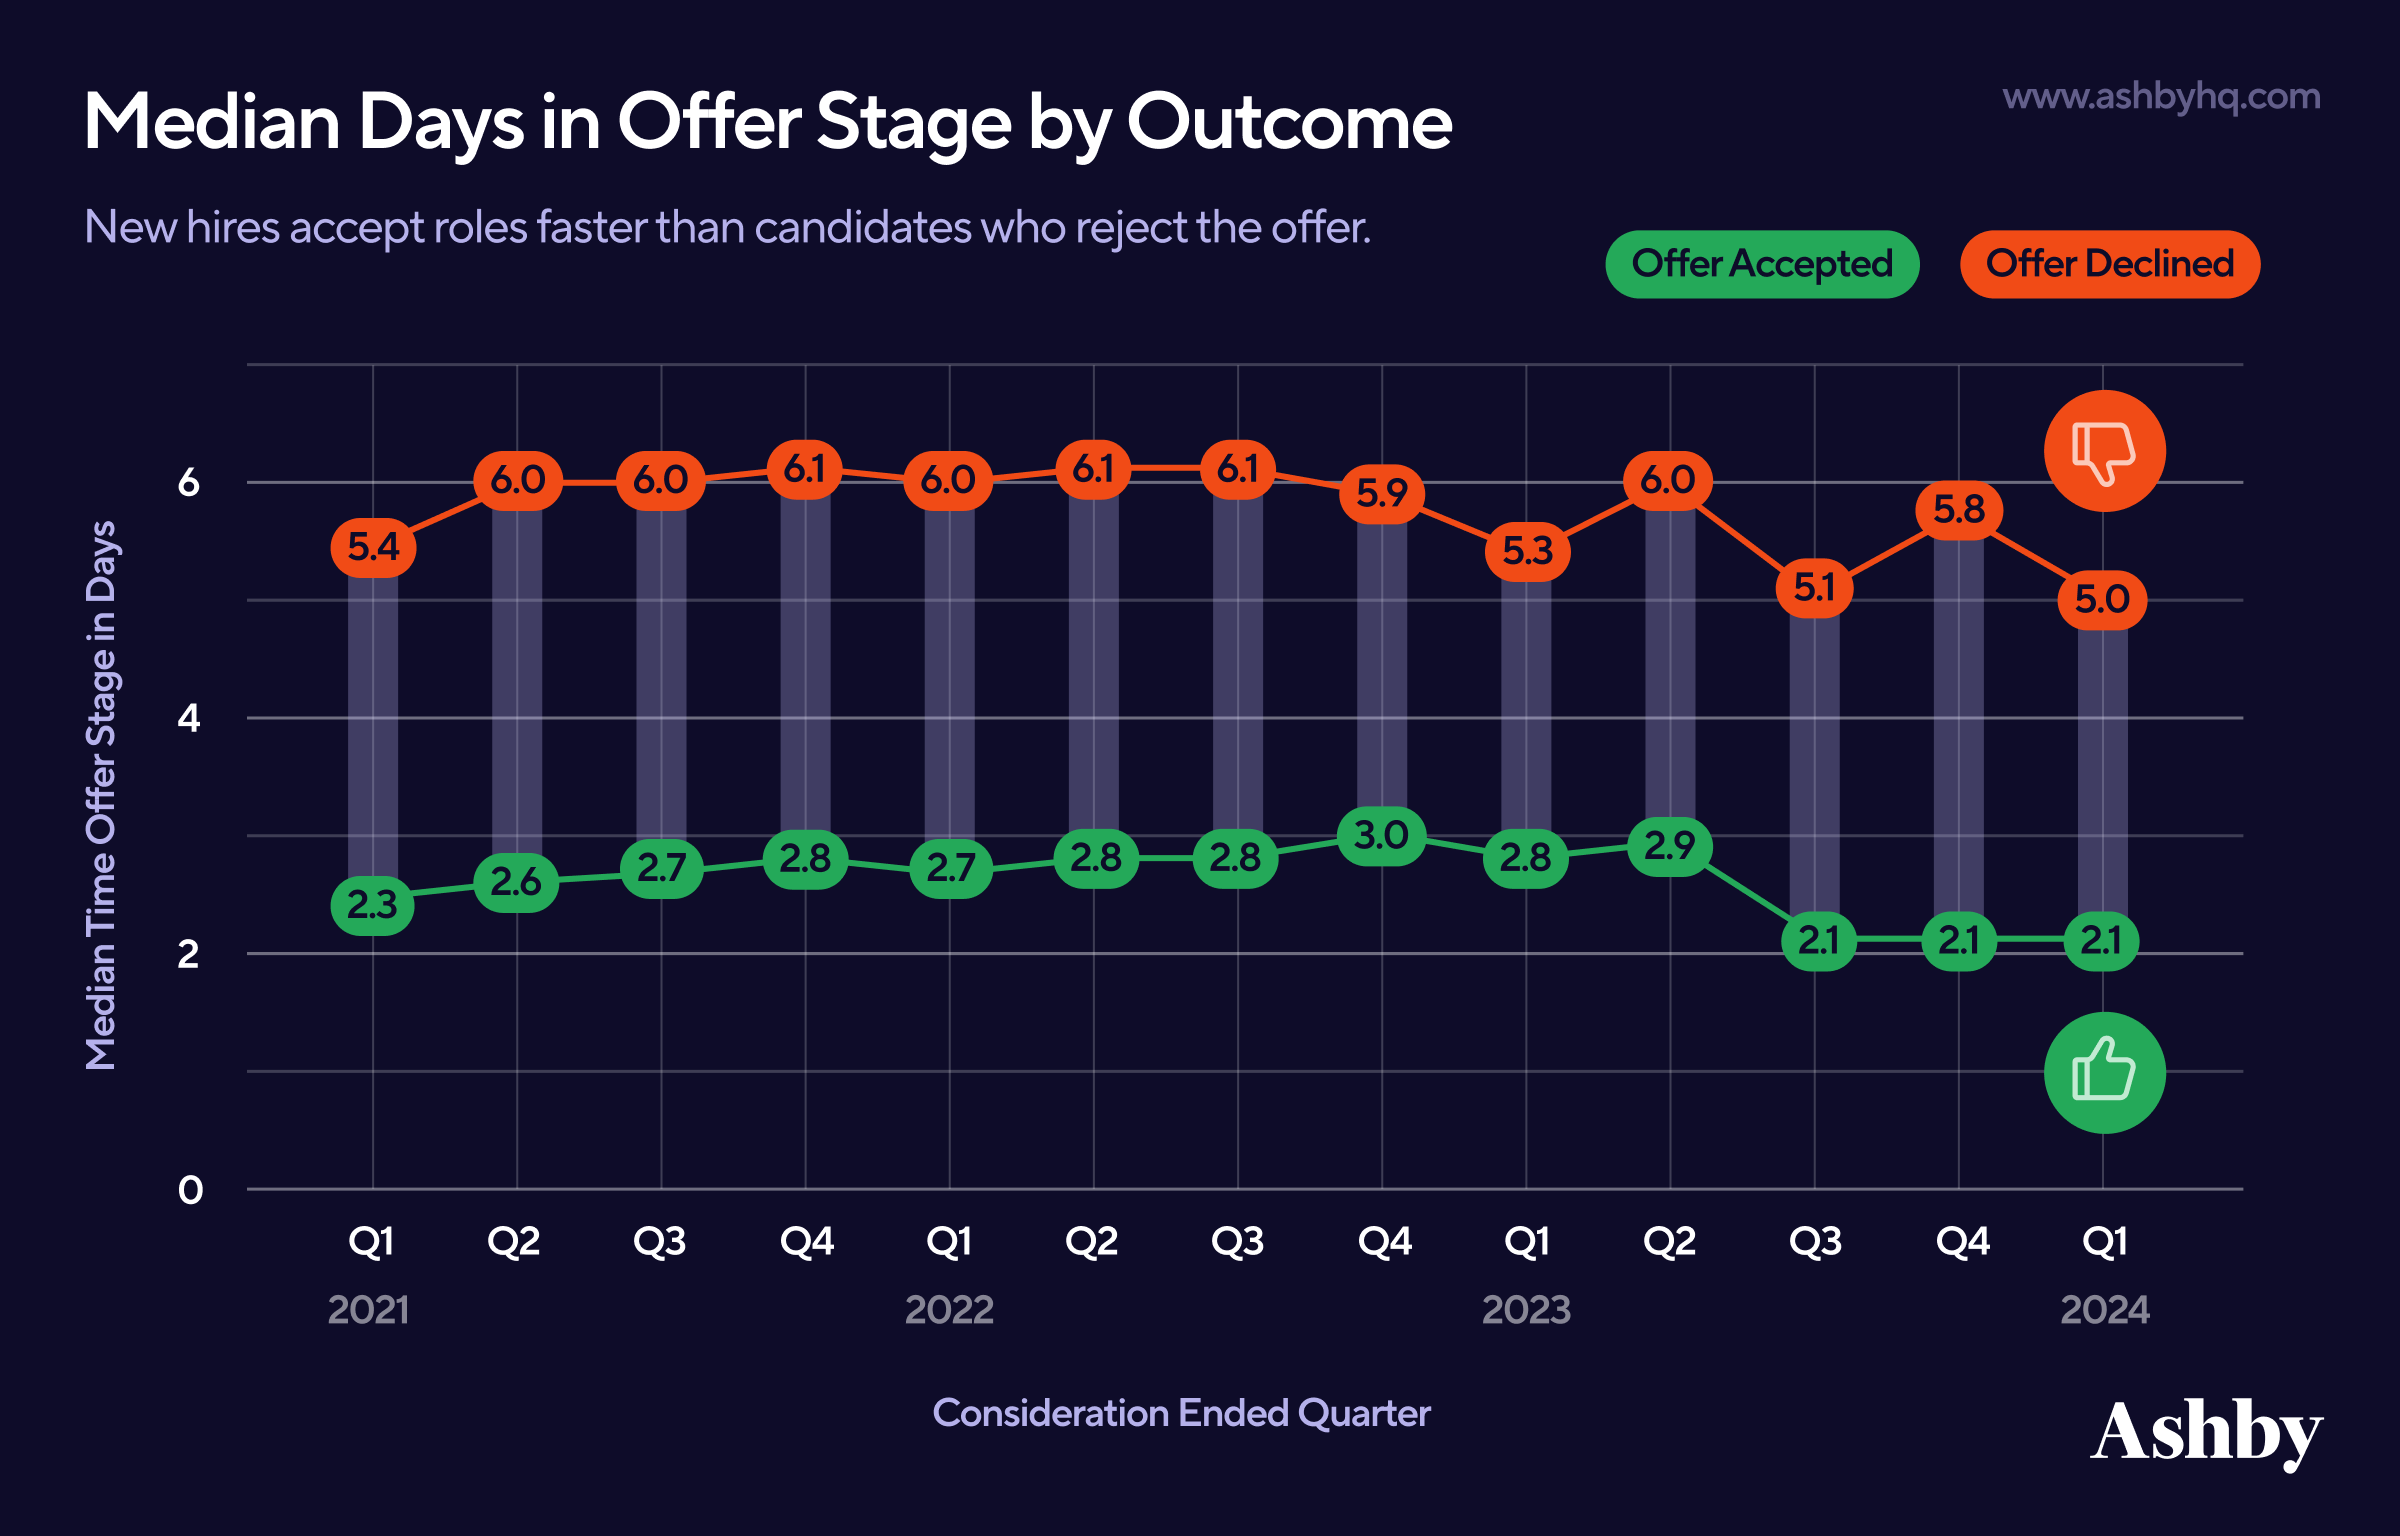
So, how does this change for candidates who accept the job offer versus candidates who decline? Over our studied time period, we found that:
- For candidates who accept the job, Time in Offer was roughly 2.8 days until Q2 2023, at which point it fell to two days. In other words, new hires accepted the offered role within two days of formally receiving it.
- For candidates who decline (and so get archived), Time in Offer was closer to six days.
- Overall, we also see that OAR increases as Time in Offer decreases.
This collective data overall signals that if a candidate plans on accepting a role, it likely happens quickly. Here at Ashby, we intuitively believe that speed in the hiring process increases the odds of closing a candidate. This may be important for recruiting teams to consider if not part of your strategy today. For example, not sending a candidate an offer quickly enough could result in a decline.
Time in Offer Stage: Business vs Technical Roles
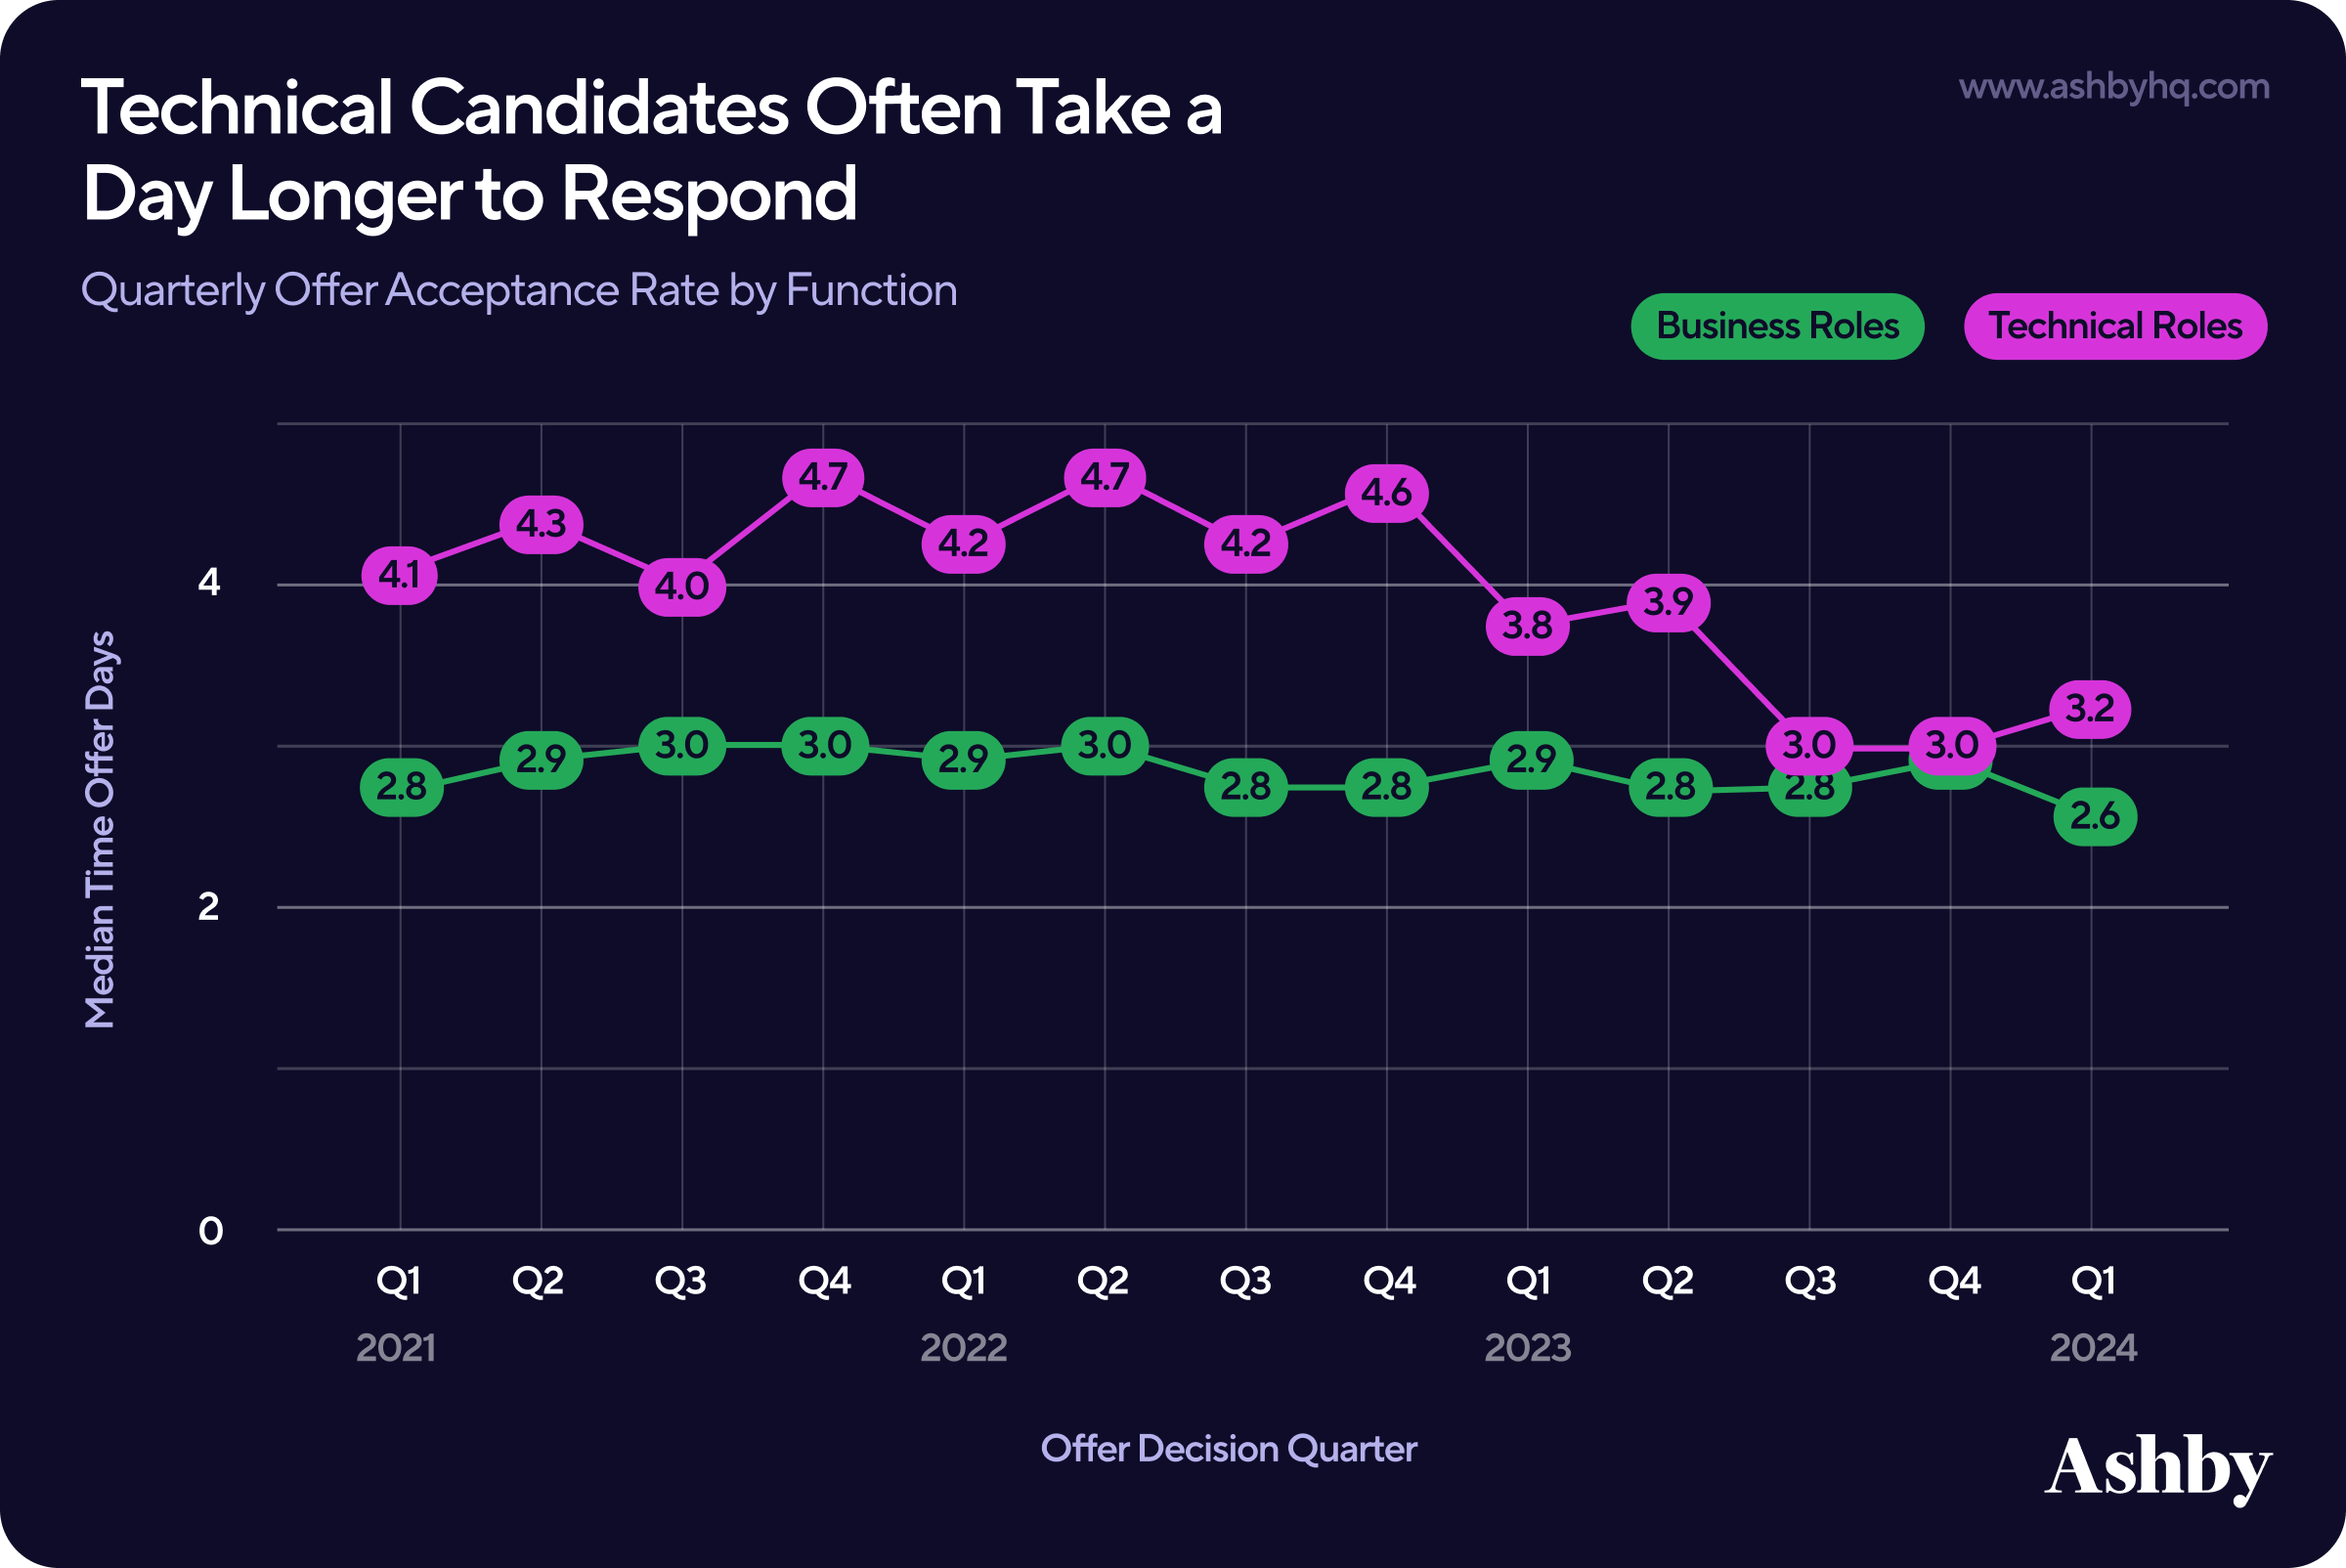
When looking at the initial Offer Acceptance data by job function, we find that the median Time in Offer Stage sees striking differences. Time in Offer for business roles has remained relatively unchanged, while tech roles represent more variance and often take (at minimum) a day more for a candidate to respond.[Tweet This]
- Business Roles: Time in Offer remains relatively unchanged at a consistent ~3 days.
- Technical Roles: Time in Offer follows the global directional trend, but consistently sits above the global trend at roughly 4 days instead of 3.
Time in Offer Stage’s Relationship with Offer Acceptance Rate
When looking at these two recruiting metrics together, we noticed an inverse relationship in more recent quarters: As the number of days in the offer stage decreases, the overall Offer Acceptance Rate increases. [Tweet This]
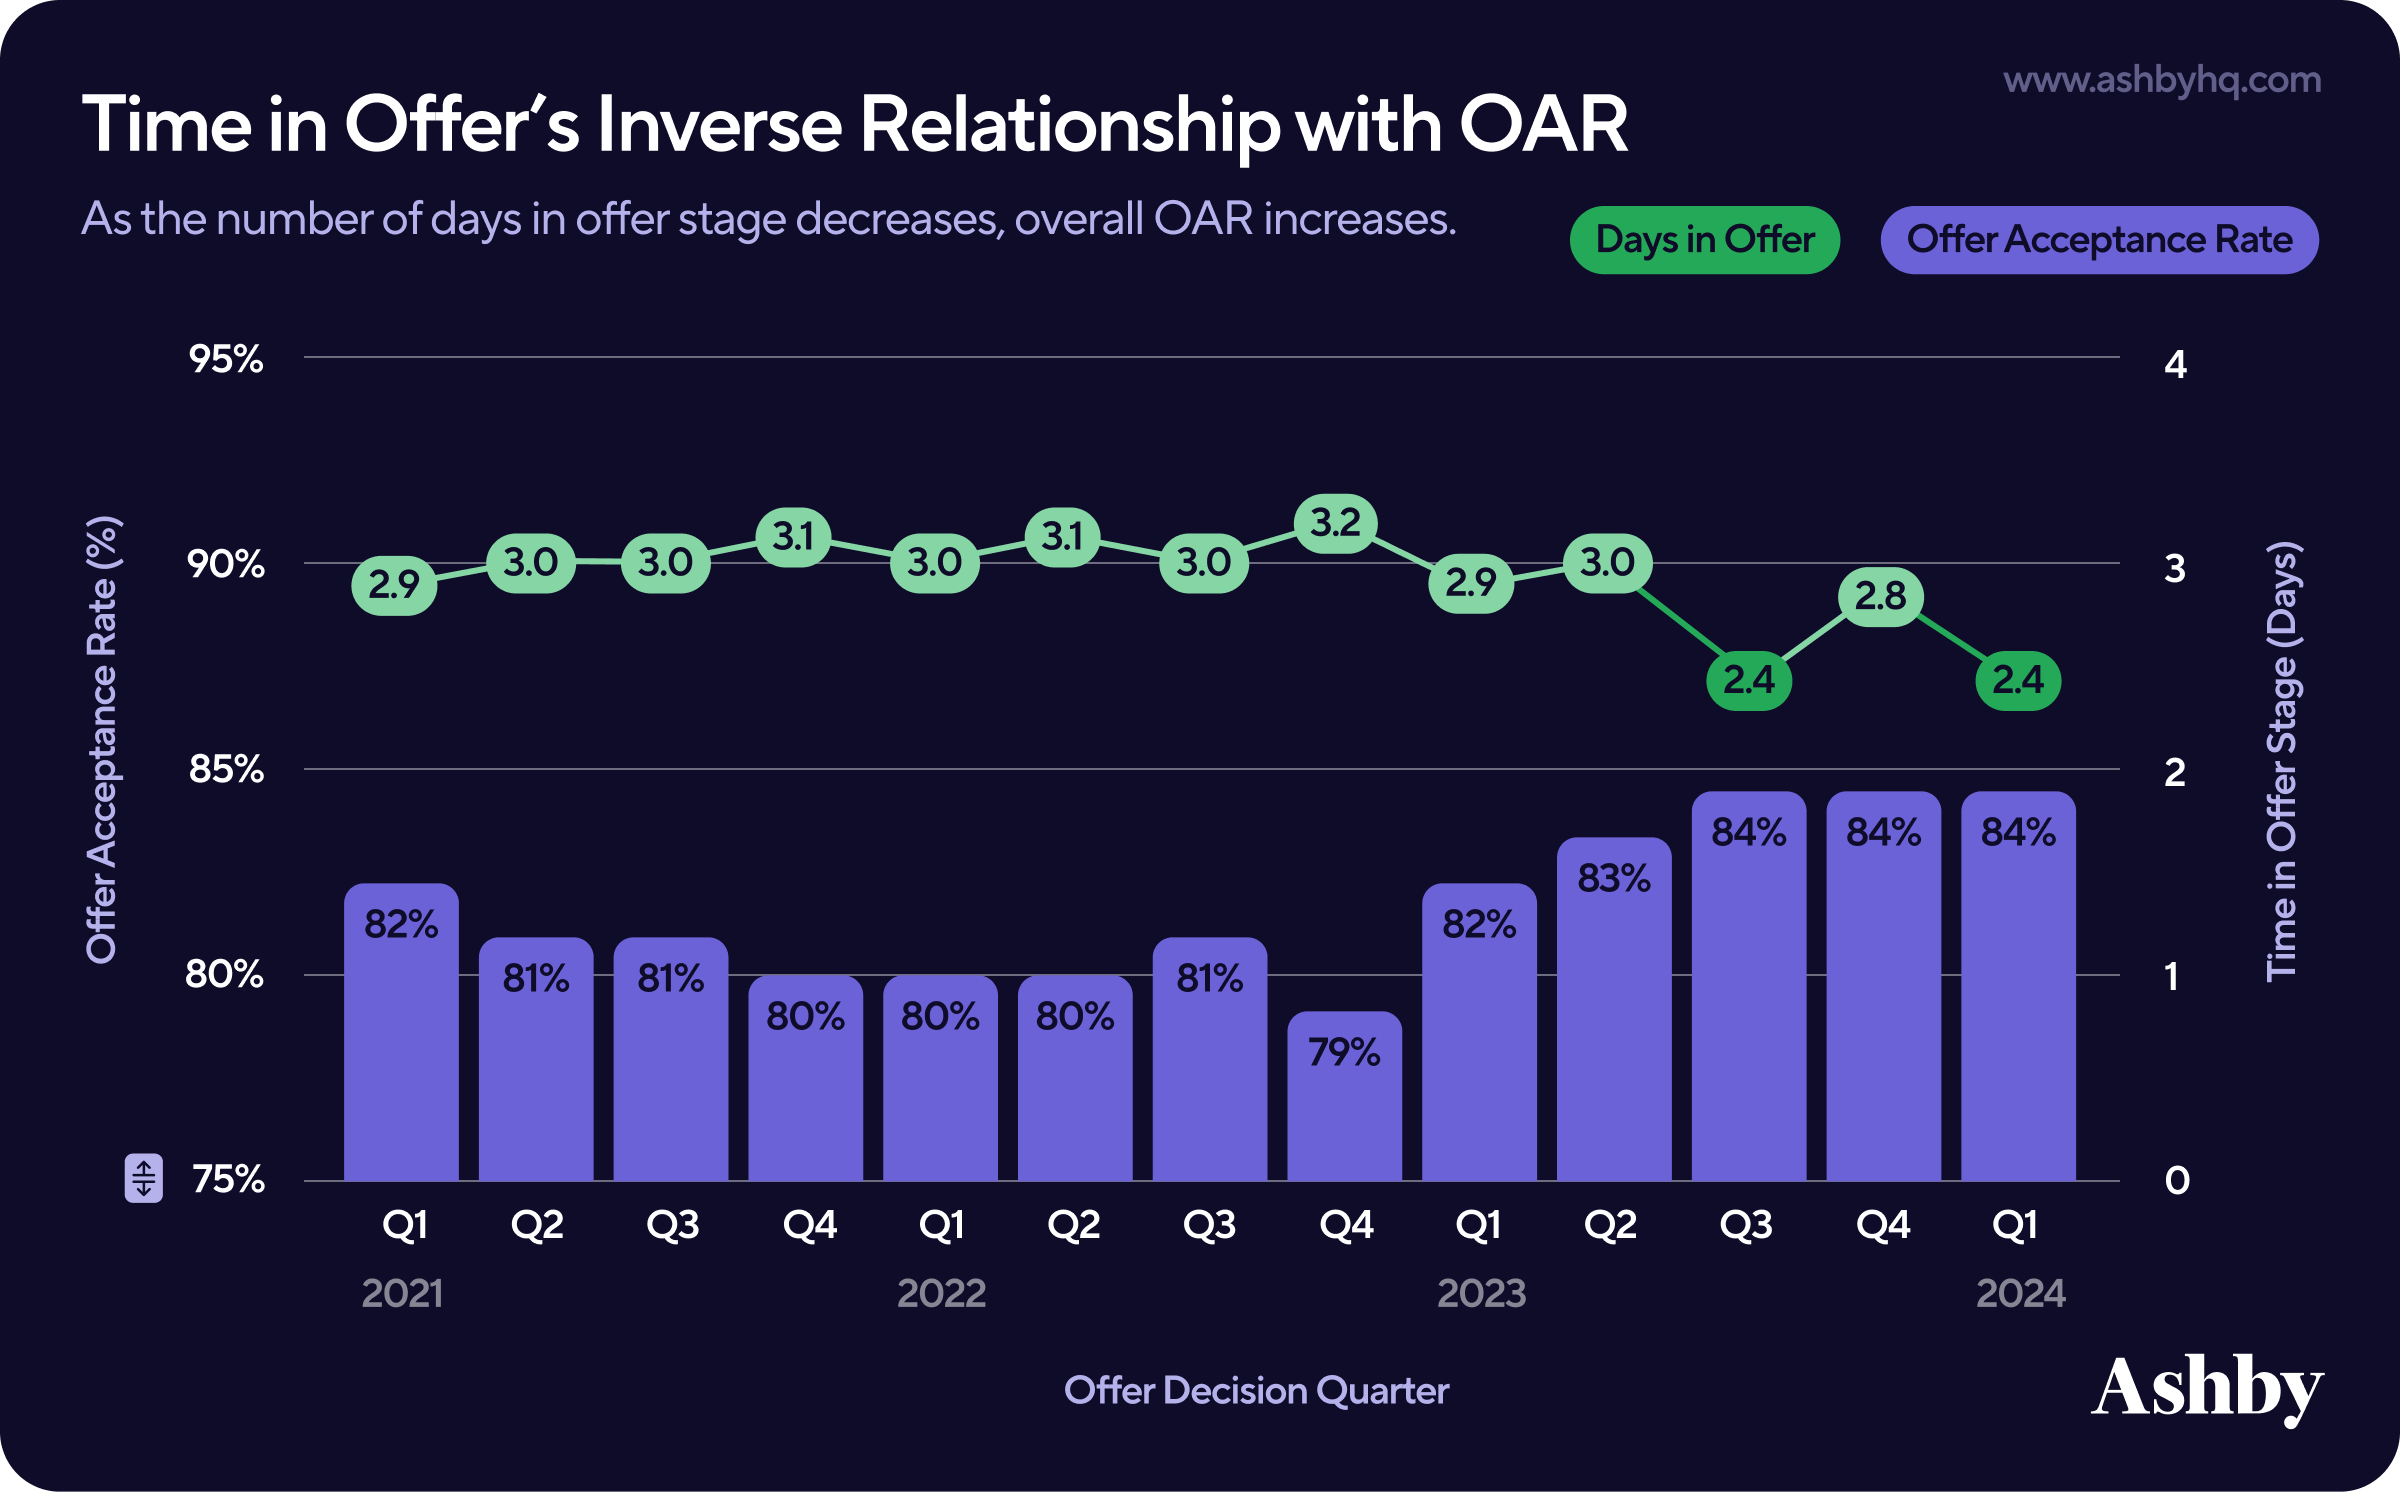
This becomes particularly interesting when observed alongside the changes in the hiring environment over the same time periods: More recently, the number of applicants available grew to a point where the hiring power has swung in favor of employers. This is a sharp contrast from 2021 when companies were opening roles much more frequently and, in some cases, applying less scrutiny in their interview process.
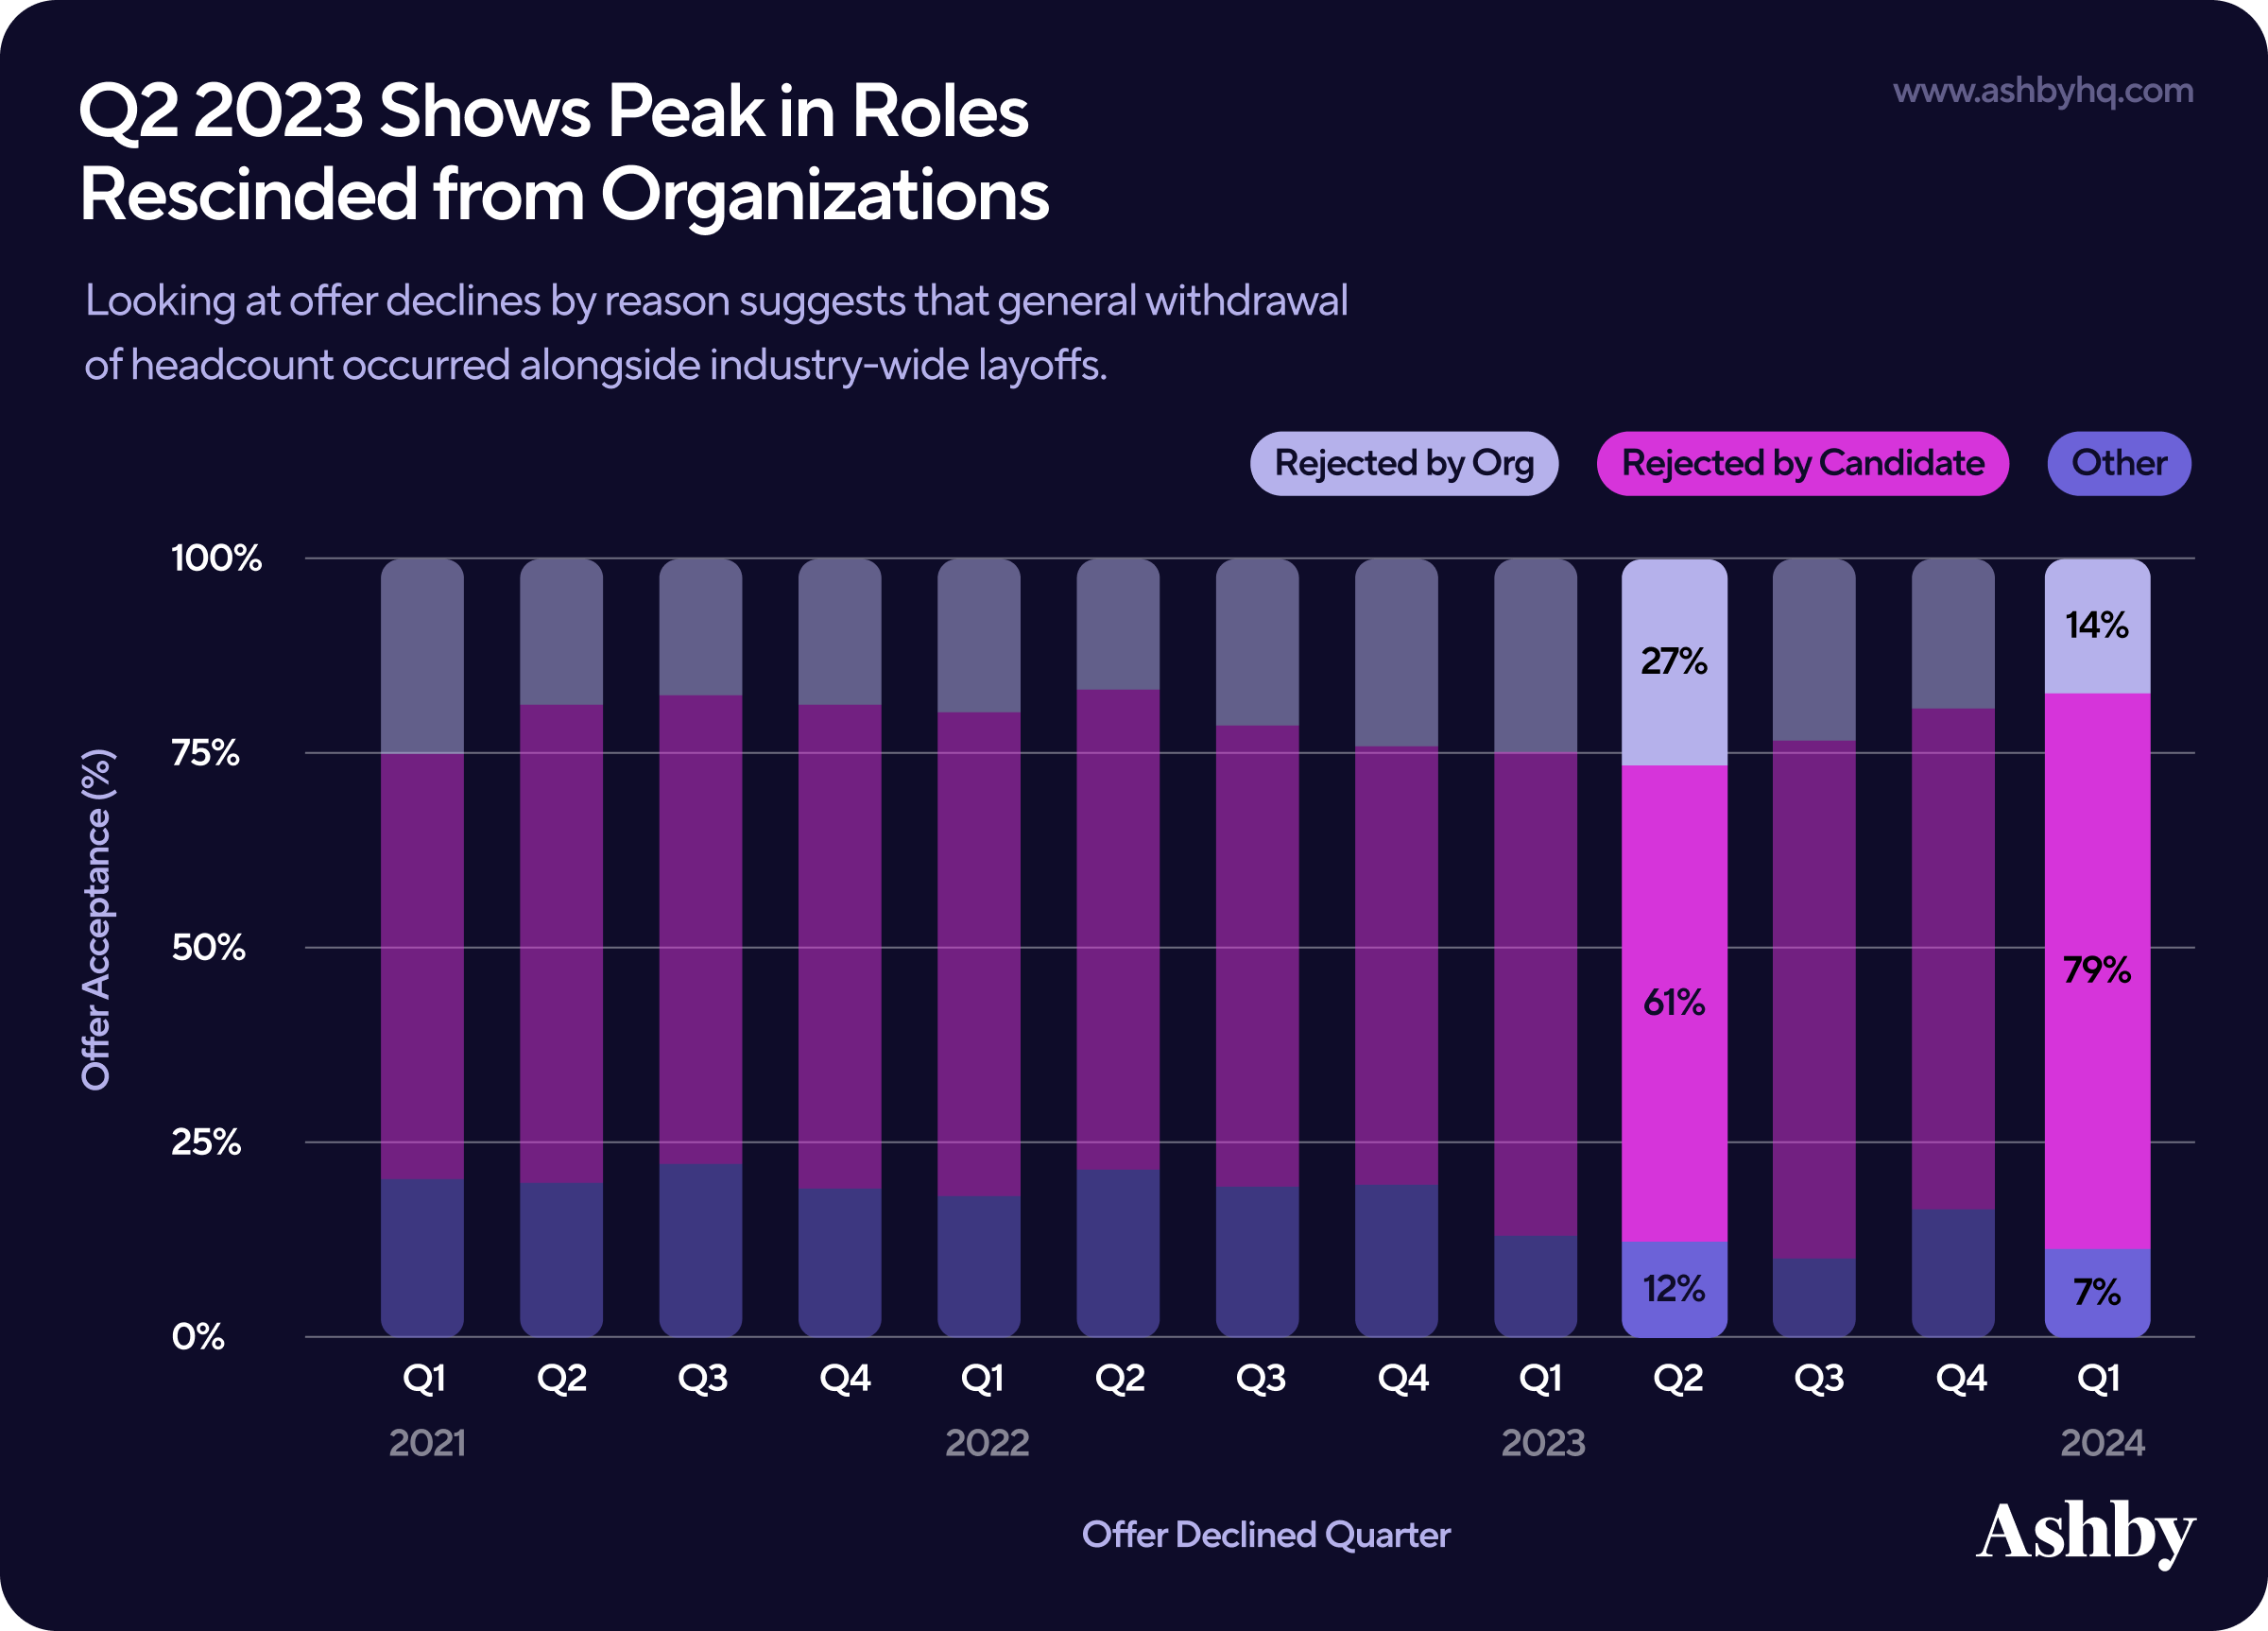
Offer Declines by Reason
As the number of candidates for a role increases (we reported on a 2-3x increase in inbound applications from 2021 to 2024 here), we were curious to explore trends in where offer rejections stem from. We can immediately see in the data that offer rejections primarily come from candidates.
That said, there is a peak in more roles rescinded from the organization hiring from Q4 2022 through Q3 2023. Rejection reasons here could include the role being closed, not being able to meet salary requirements or candidate expectations, and so on. It’s interesting to note that this time period again lines up with industry-wide layoffs, suggesting that general withdrawal of headcount for any reason could be a stronger factor than other quarters.
A fascinating trend emerged when we studied rejections by an organization and split it by function. Here we found that:
- Offers rescinded by the organization represent 17% of declined offers for technical roles.
- Offers rescinded by the organization represent 27% of declined offers for business roles.
In other words, companies are much less likely to rescind an offer for a technical role as they are a business role [Tweet This].
For recruiting teams, this is valuable insight in understanding conversion rate, onboarding, follow ups required, and more for business versus technical roles.
Let’s take relative cost as one example. If one in four roles reach the offer stage and the organization decides to rescind, that’s a lot of invested hours by the recruiting team and extended interview panel wasted. Understanding this context sooner than later helps positively influence recruiter productivity.
Offers Accepted by Source
We often hear theories online about which sources lead to hiring the best candidates or which sources help a candidate make it to the interview stage. In reviewing the source of offers across our data, we found some helpful data-driven context behind supporting or refuting such assumptions.
When looking at the composition of source channels behind accepted job offers, we can quickly see:
- the fewest hires come from internal, agencies, and external job boards
- the most hires come from inbound applications, growing even faster since Q1 2023
- candidate sourcing efforts and referrals sit in the middle as solid contributors
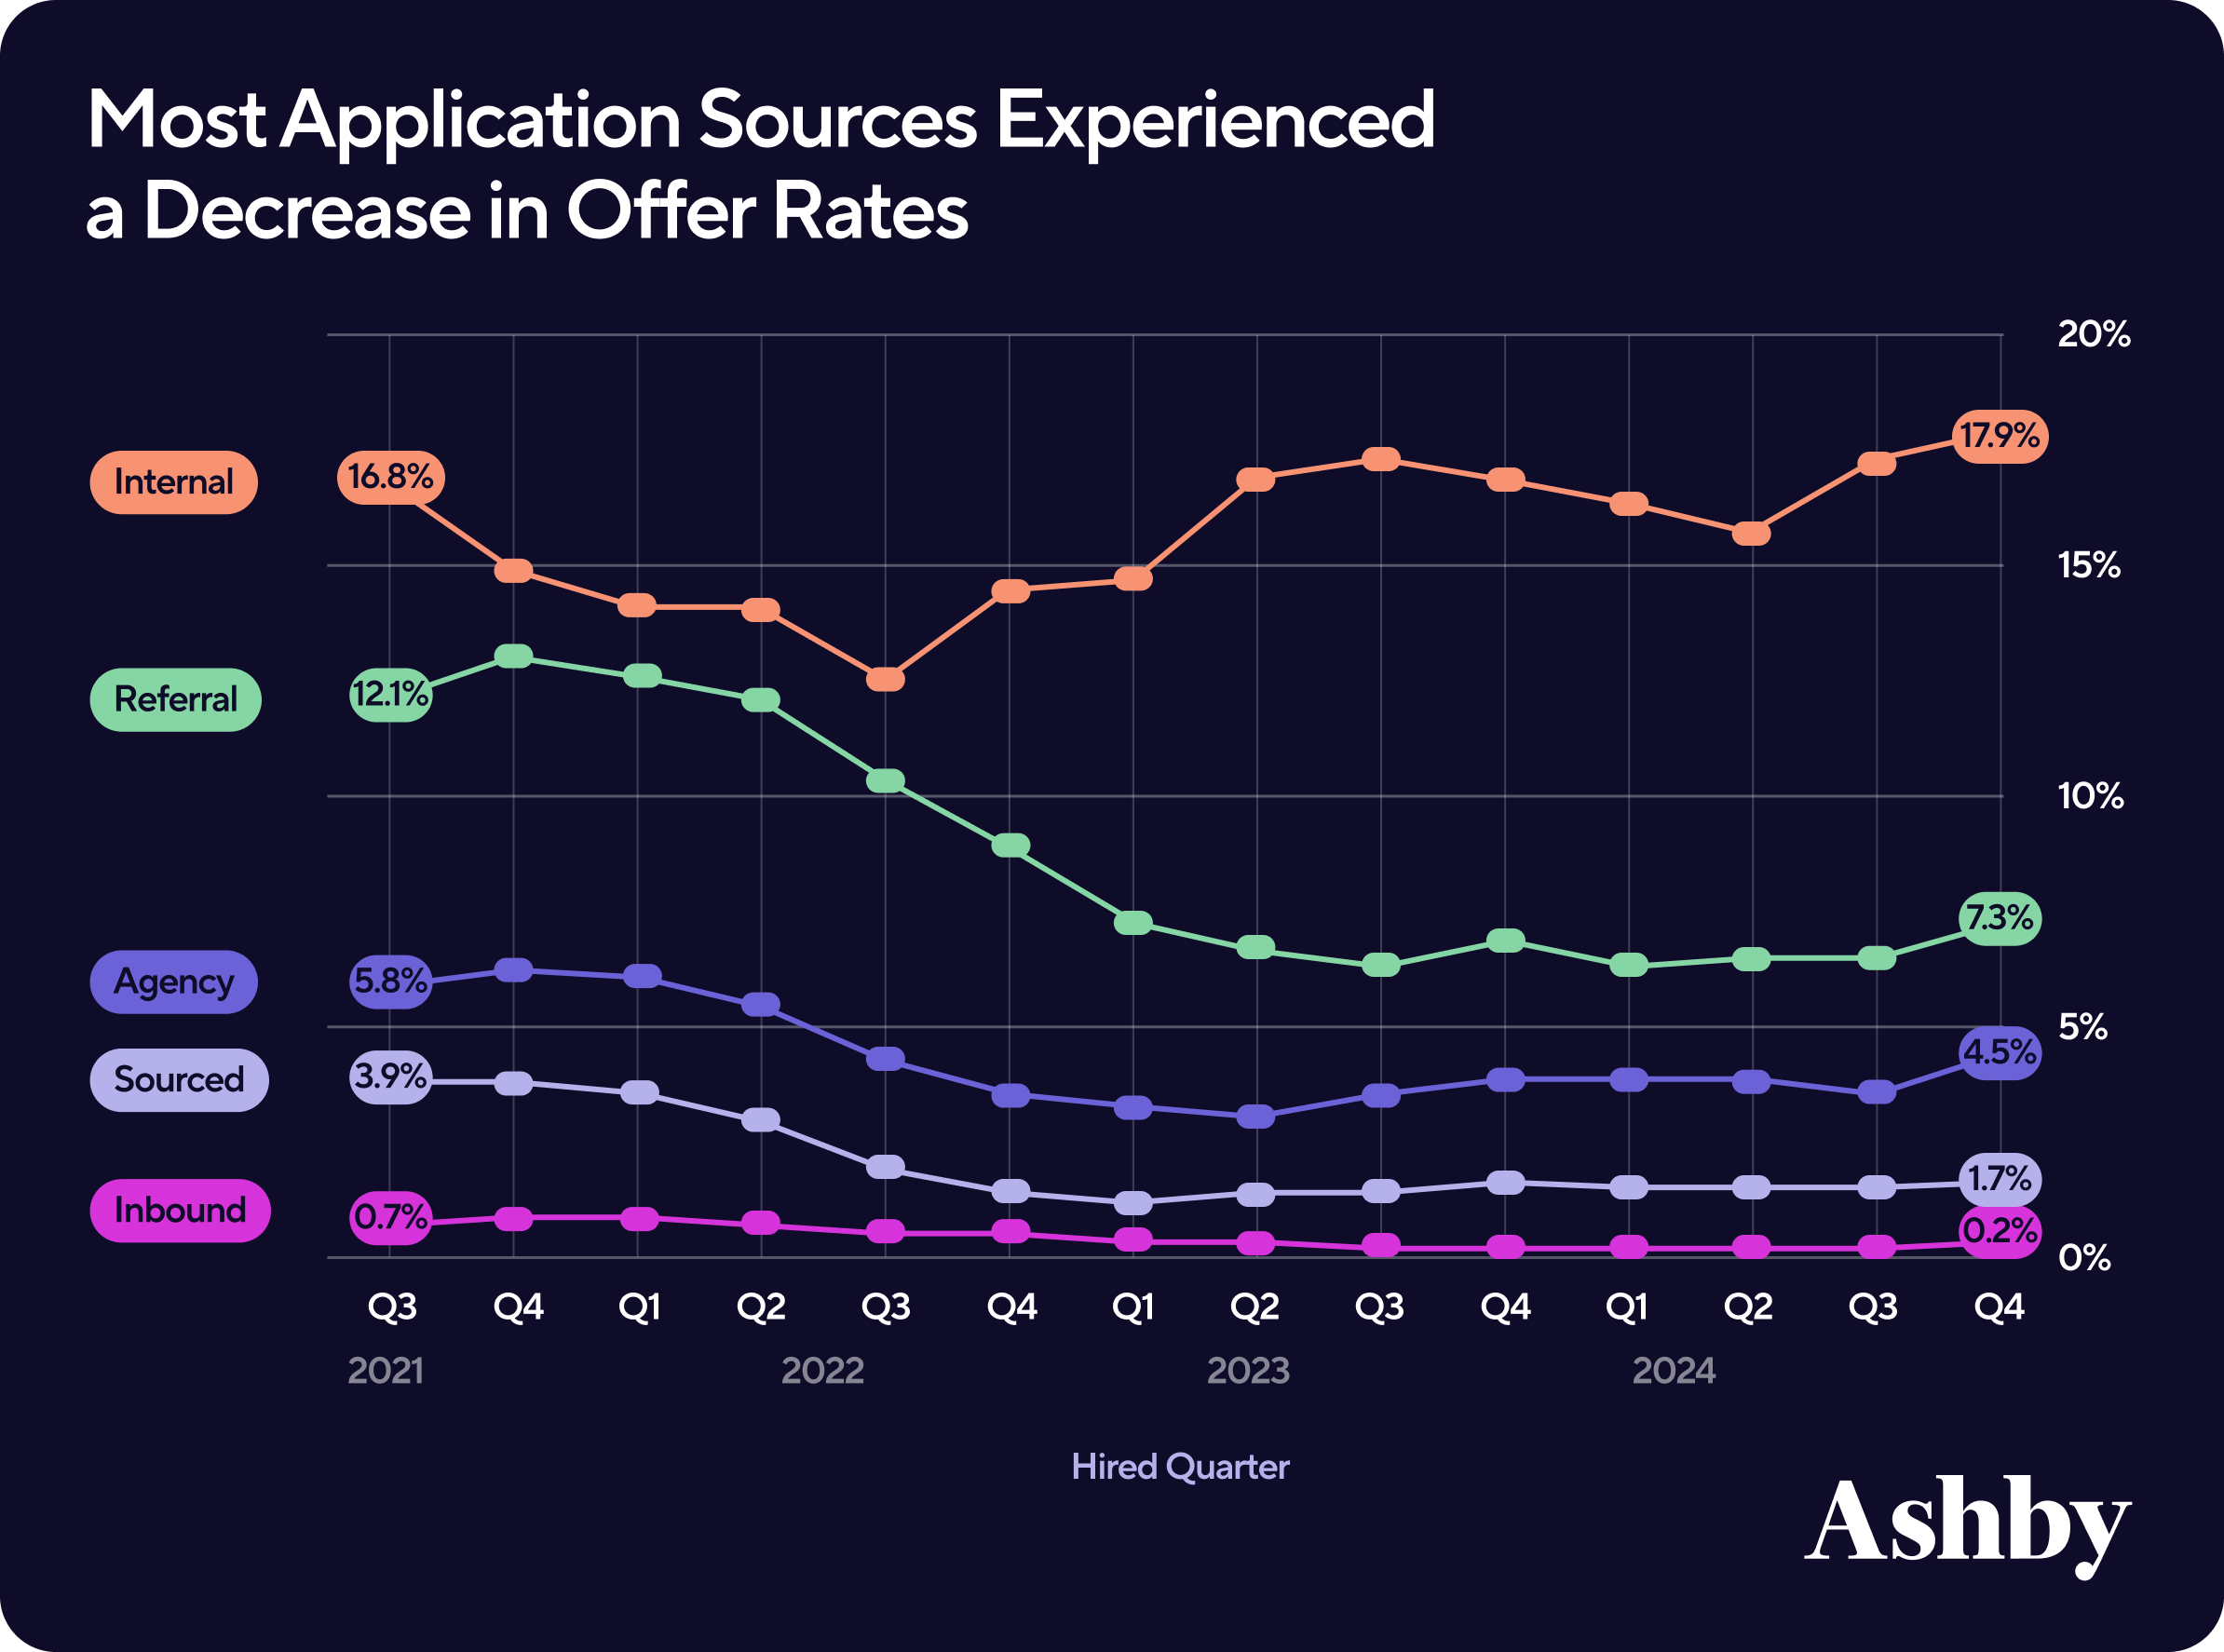
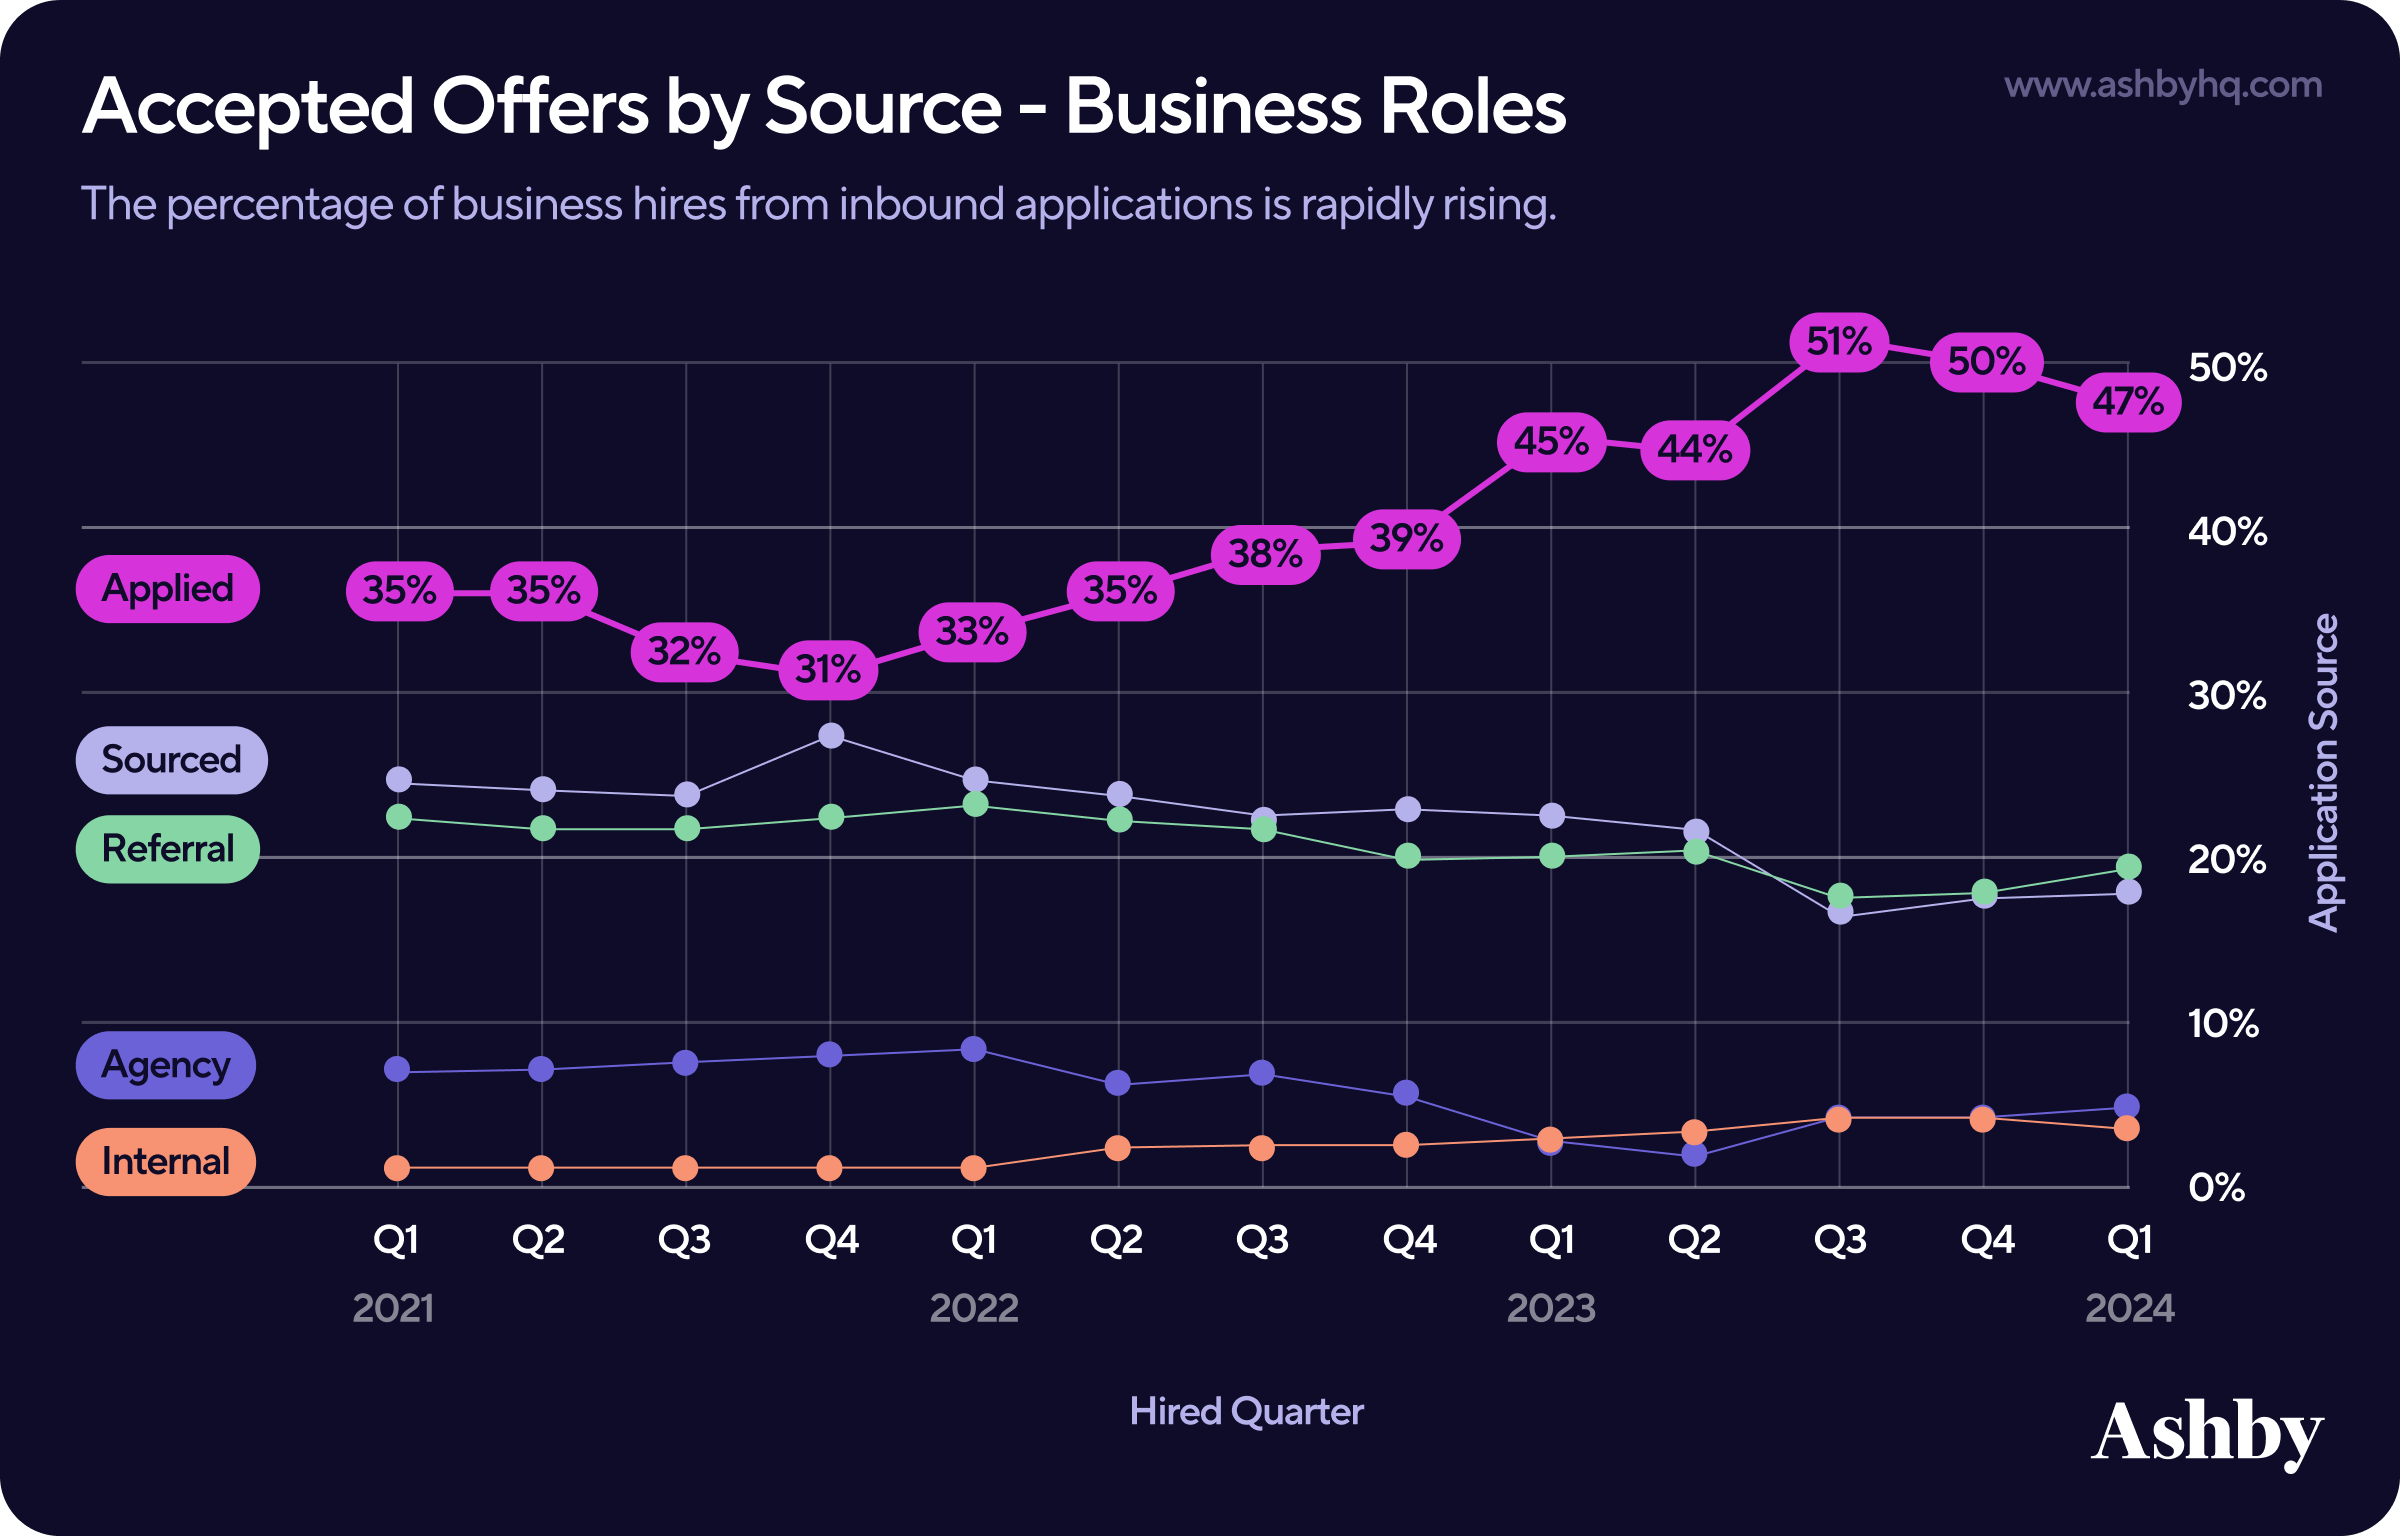
In studying each of these sources, we found general stability across all but one. Over the three year period analyzed, inbound as a source of hires massively trends upwards. This is in line with data we revealed in February 2024 in our Applications per Job report ahead of our launch of Quality of Hire surveys.
Easily Track Offer Analytics
Of course the best way to track performance is your own historic data. These recruiting benchmarks hope to serve as overarching guides or reference points to your work. Natively in Ashby, there are a number of Core Dashboards that represent a suite of specific insights to help TA teams track performance.
One of these is called “Offer Dashboard,” which automatically allows talent teams to track a number of recruiting metrics — some of which you may recognize from the report above!
- In Offer: The total number of candidates who are currently in the Offer stage group. When opening the report, it includes the candidate, the job, the job consideration’s recruiter, hiring manager, the number of days the consideration has been in that Offer stage group and the offer status.
- Reached Offer: The total number of job considerations, active and inactive, that have ever reached the offer stage group. By default, this report covers all time.
- Intent to Offer Acceptance Rate: The intent to offer acceptance rate is the total hires over the total number of job considerations that have ever reached the offer stage. By default, this report covers all time.
- Offer Acceptance Rate Details: A further breakdown of the offer outcomes that lead to the offer acceptance rate, listing the offers decided, the offers accepted and the offers rejected.
- Offer Acceptance Rate Overall: The offer acceptance rate across each month. By default this report shows the last 12 months.
- Offer Decline Reasons: A chart showing the reasons added to offers when they are declined by the candidate.
- Time to Offer by Department: The average number of days it takes for a job consideration to reach the Offer stage from when it was first started. This report is grouped by department.
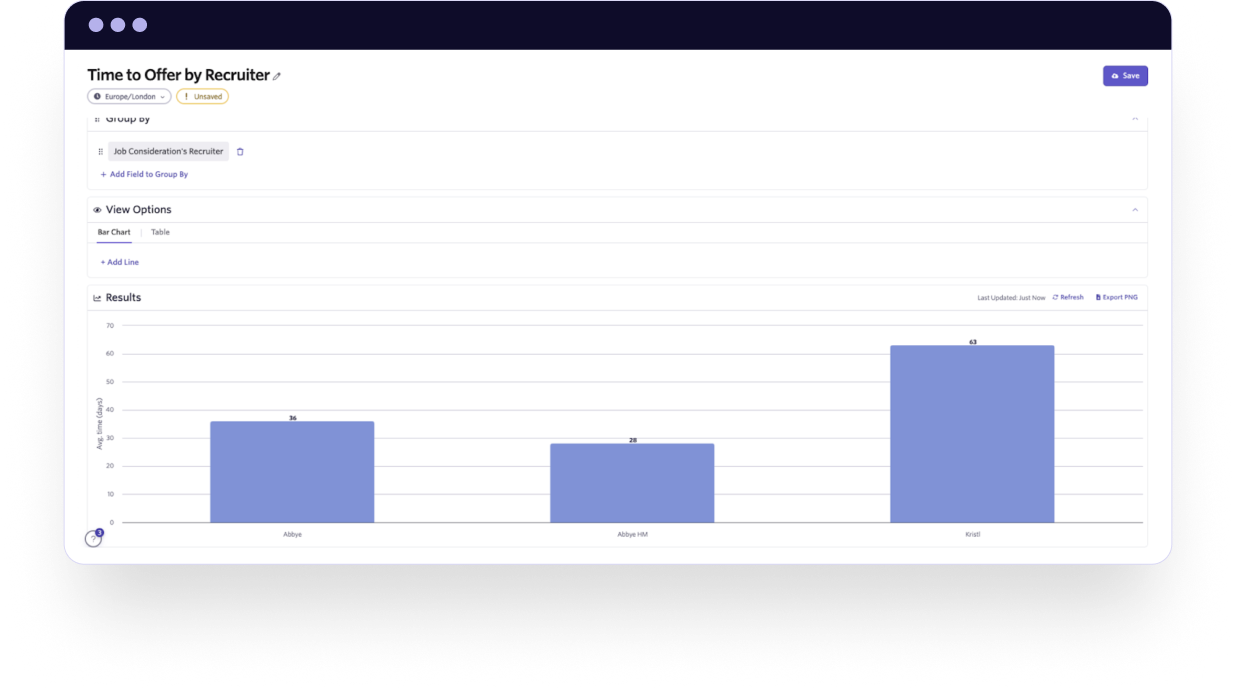
- Time to Offer by Recruiter: The average number of days it takes for a job consideration to reach the Offer stage from when it was first started. This report is grouped by the recruiter listed on the job consideration.
Curious to take a closer look for yourself? Customers can contact their CRM or if you’re new to Ashby — request a demo here.
Conclusions
Through analyzing 230K applications that reached the offer stage from January 2021 through March 2024, we ultimately found:
- Offer Acceptance Rate has fluctuated alongside changes in the macro hiring environment.
- Industries with the proportionally largest amount of technical role hiring correlate with the lowest offer acceptance.
- There has been a clear trend in more job offers coming from inbound applications in recent months.
We hope these insights help talent teams navigate, evolve, and inform their strategy around offer acceptance. For more recruiting insights and benchmarks, subscribe to our Talent Trends newsletter.
Other Reports

2023 Trends Report | Applications Per Job
Analyzing 13 million applications from January 2021 - April 2023 to surface key patterns around applications per job per week.

Recruiting Coordination | Talent Trends Report
An analysis of 2.8M candidates for over 5.1M interview events.

Subscribe for more talent trends and insights
We will be regularly releasing new reports around trends and insights we're seeing in our data and you will be the first to know.