Major Improvement: Recruiting Planner Visualizations and Forecasting

As the year closes and the focus shifts to 2024, we’re excited to release major improvements to the recruiting planner tool in Ashby. The recruiting planner combines historical performance data, headcount goals, and a specific time range to help you track progress and hit your hiring targets.
With this release, you’ll now have access to new visualizations, forecasting tools, and conditional color-coding based on pace to help you effectively collaborate with stakeholders and visualize your recruiting plan in a compelling way. Let’s take a look!
Color-coded conditional formatting
Configure red, yellow, and green color coding to present the health of your recruiting plan. You can fine-tune these thresholds to visually highlight where you're on track and identify areas that require focus, based on your plan's progress and the overall time elapsed.
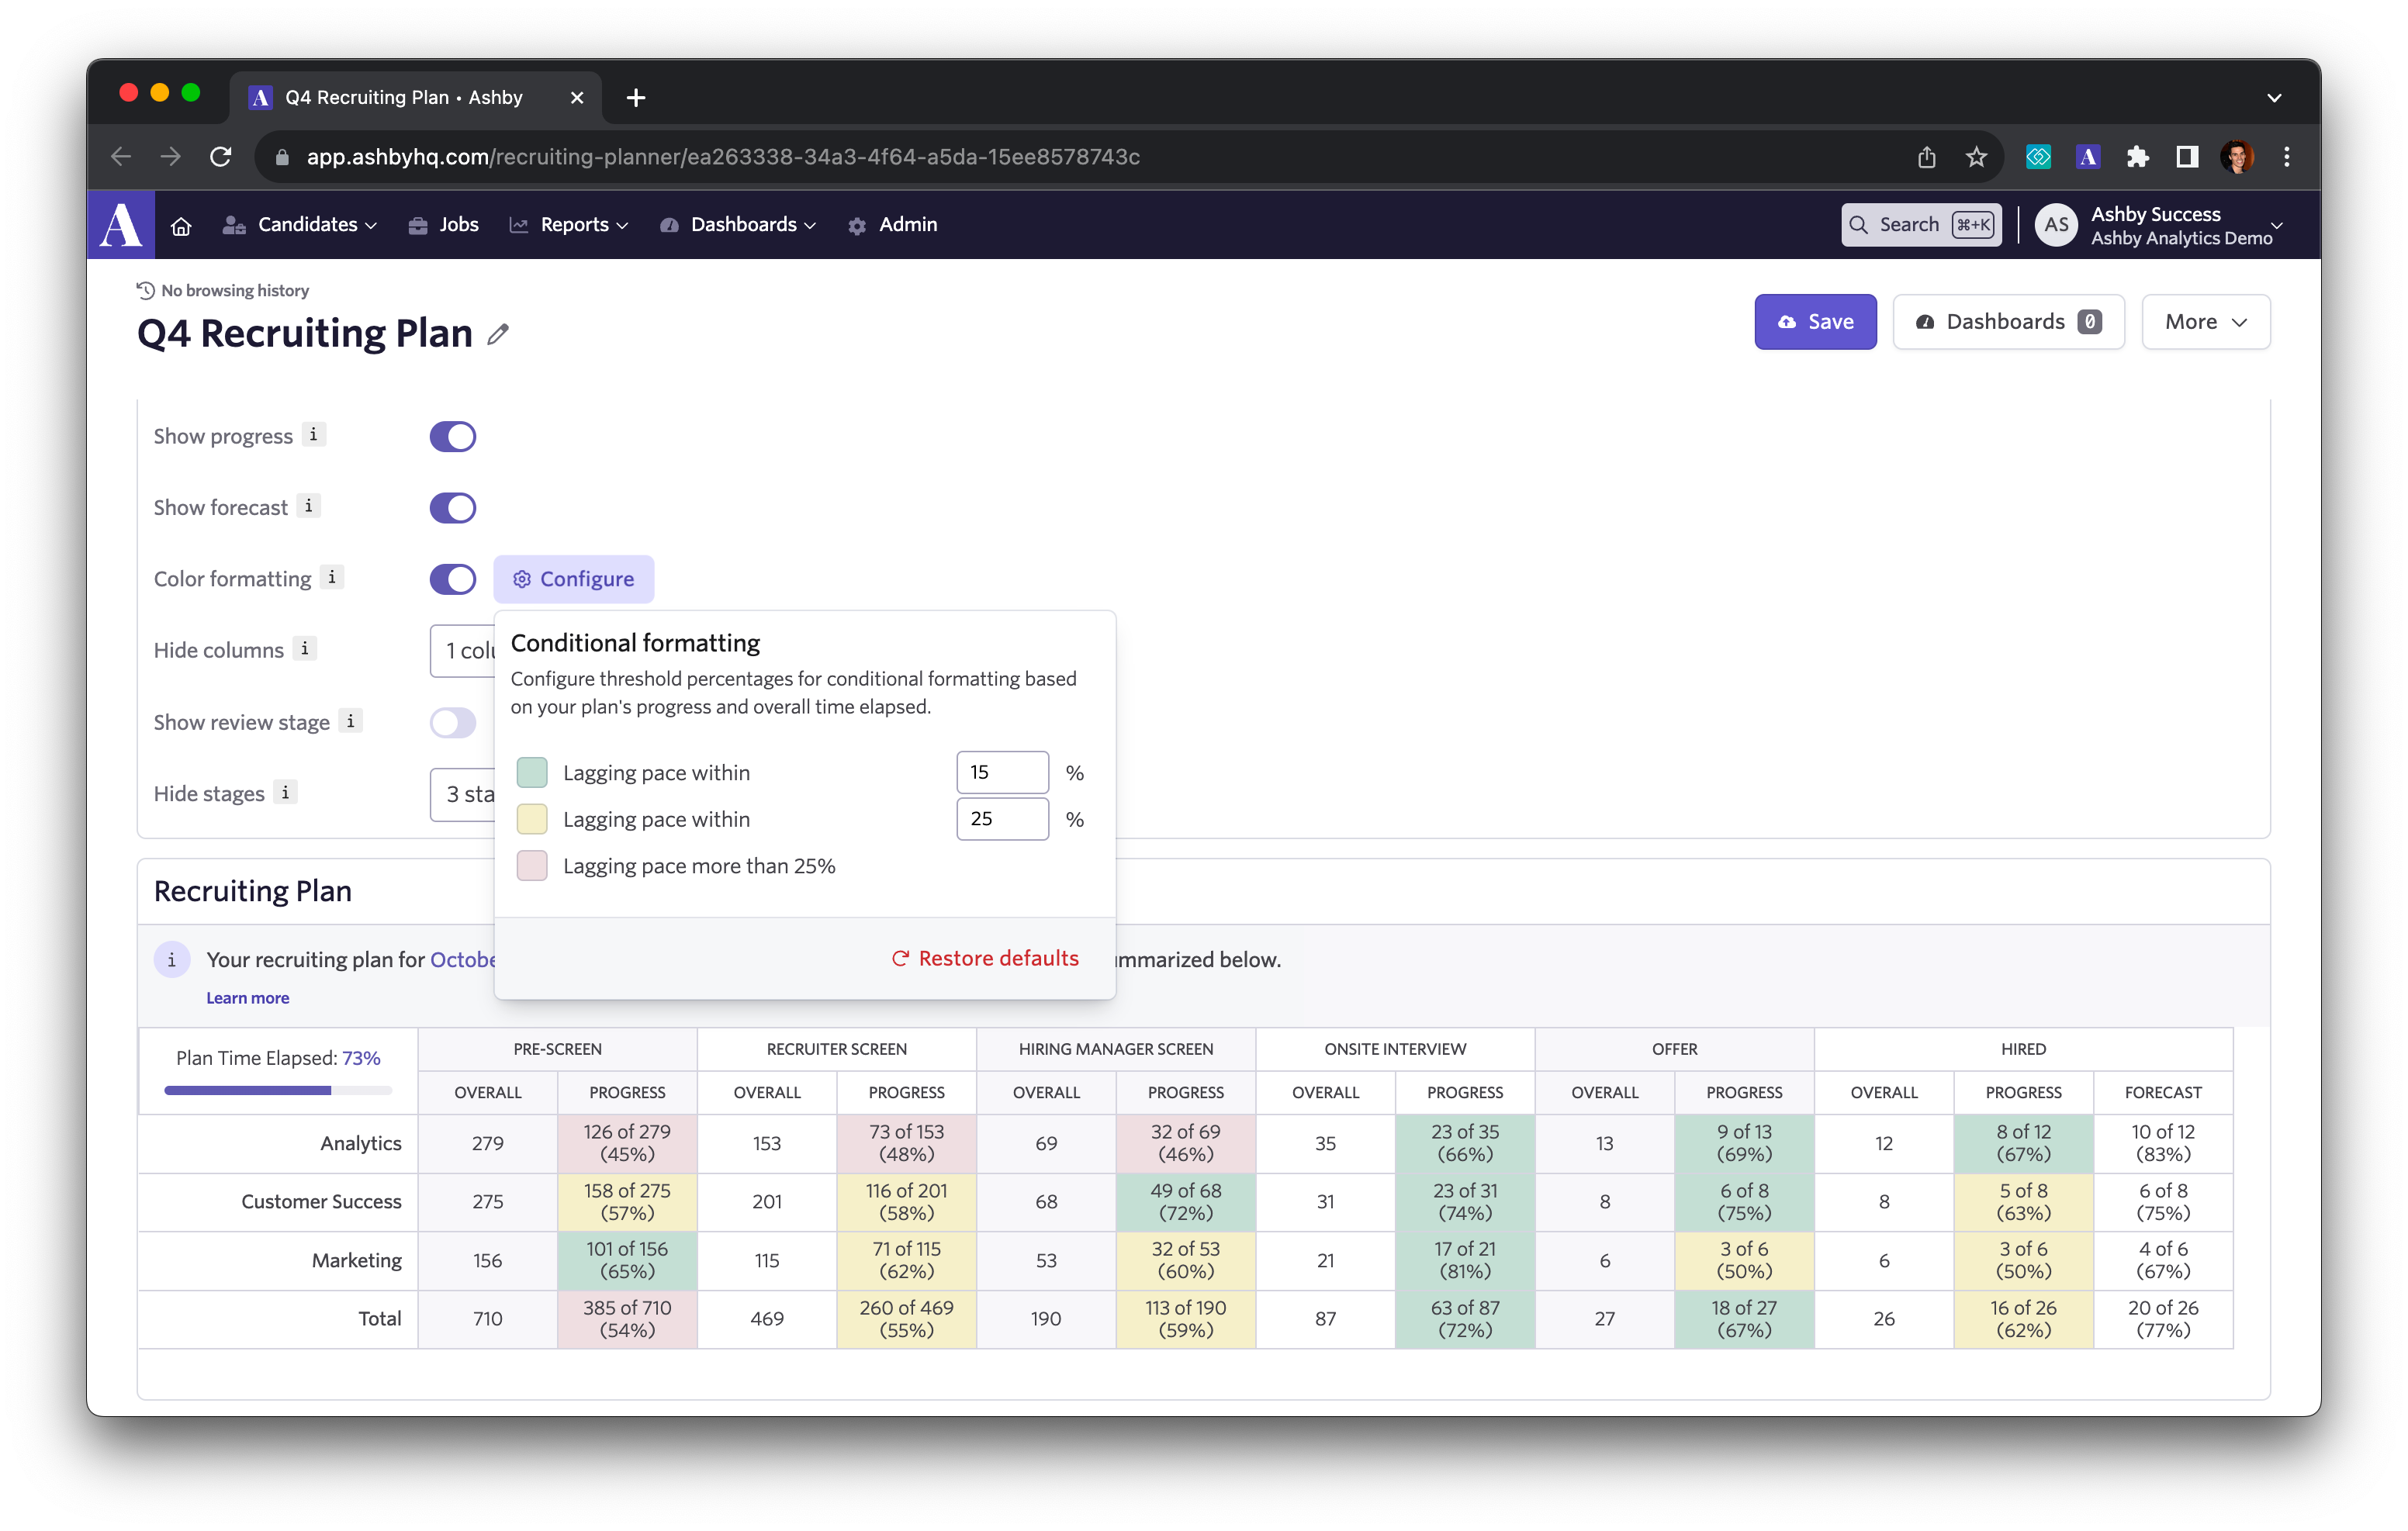
The table also comes with improved formatting, a forecasting column, and a 'Plan Time Elapsed' progress bar, providing you with a high-density view of your plan.
Viewing your hiring plan data with this type of conditional formatting helps raise when and where you need to take action to achieve your hiring goals.
New visualizations
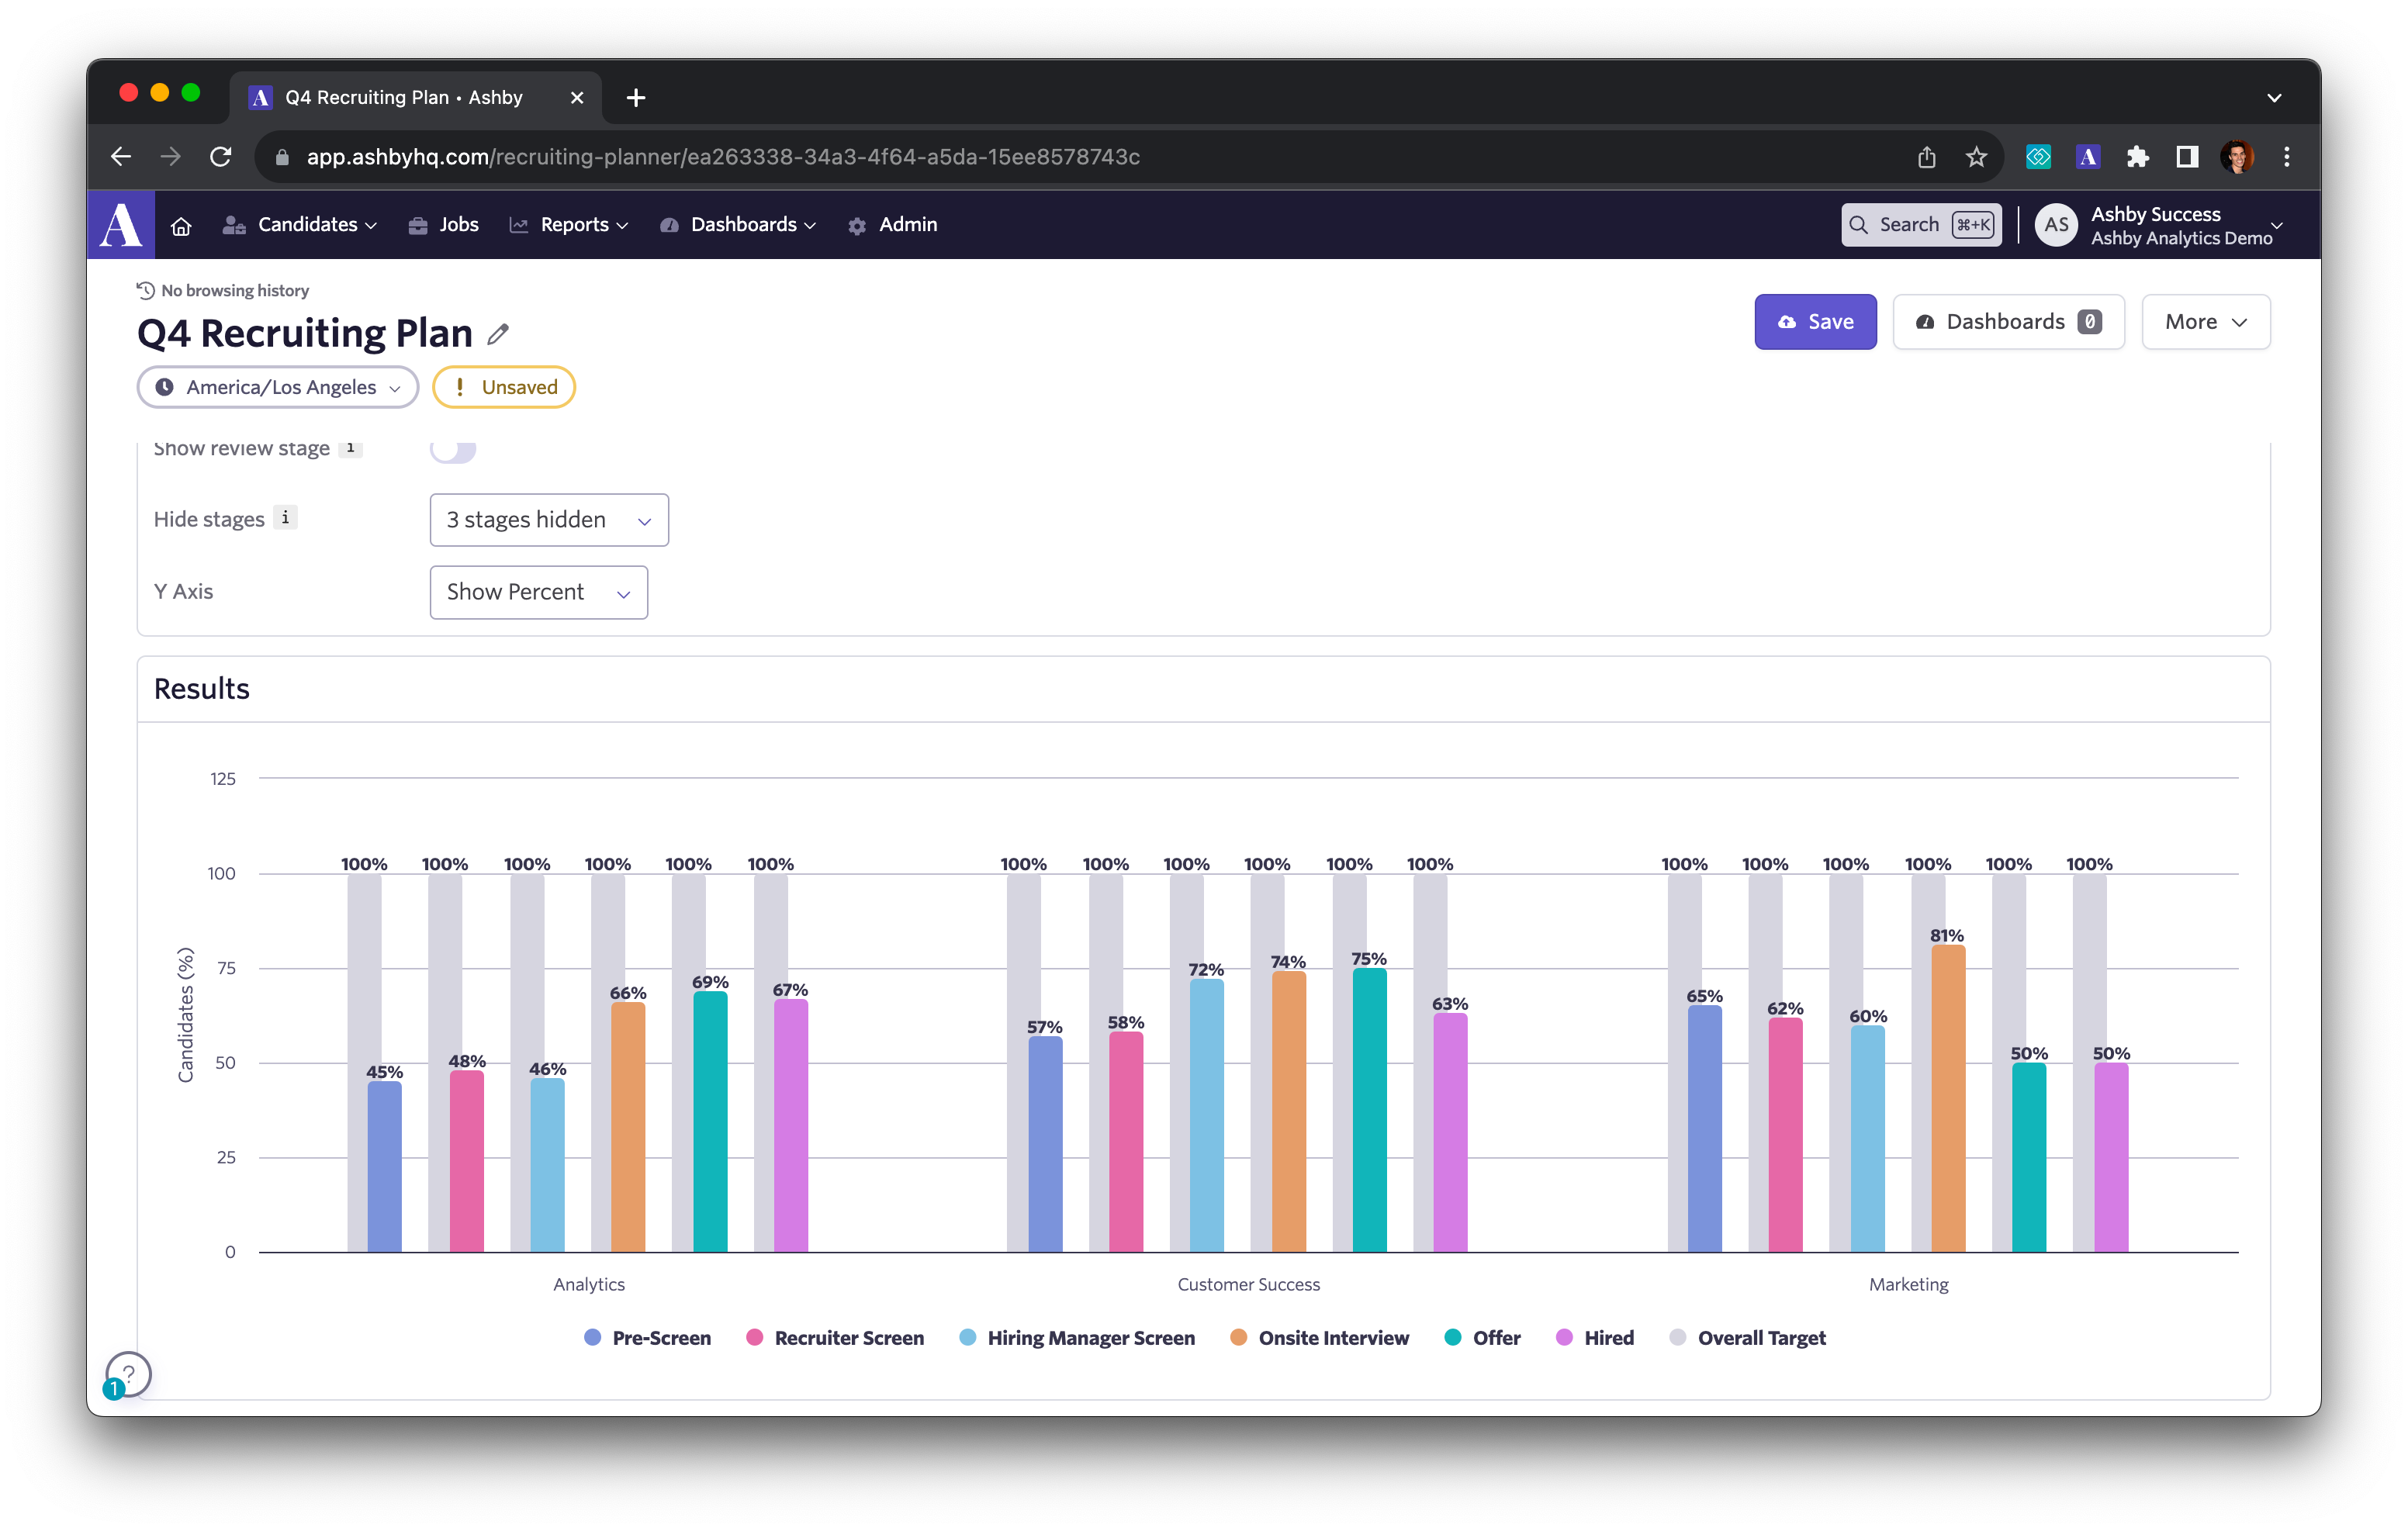
Stage Progress
Easily analyze the percentage of candidates that are proceeding through the various stages in your funnel. This view gives you a compelling visualization to demonstrate where candidates are getting stuck or where you’re volume is strong based on your plan.
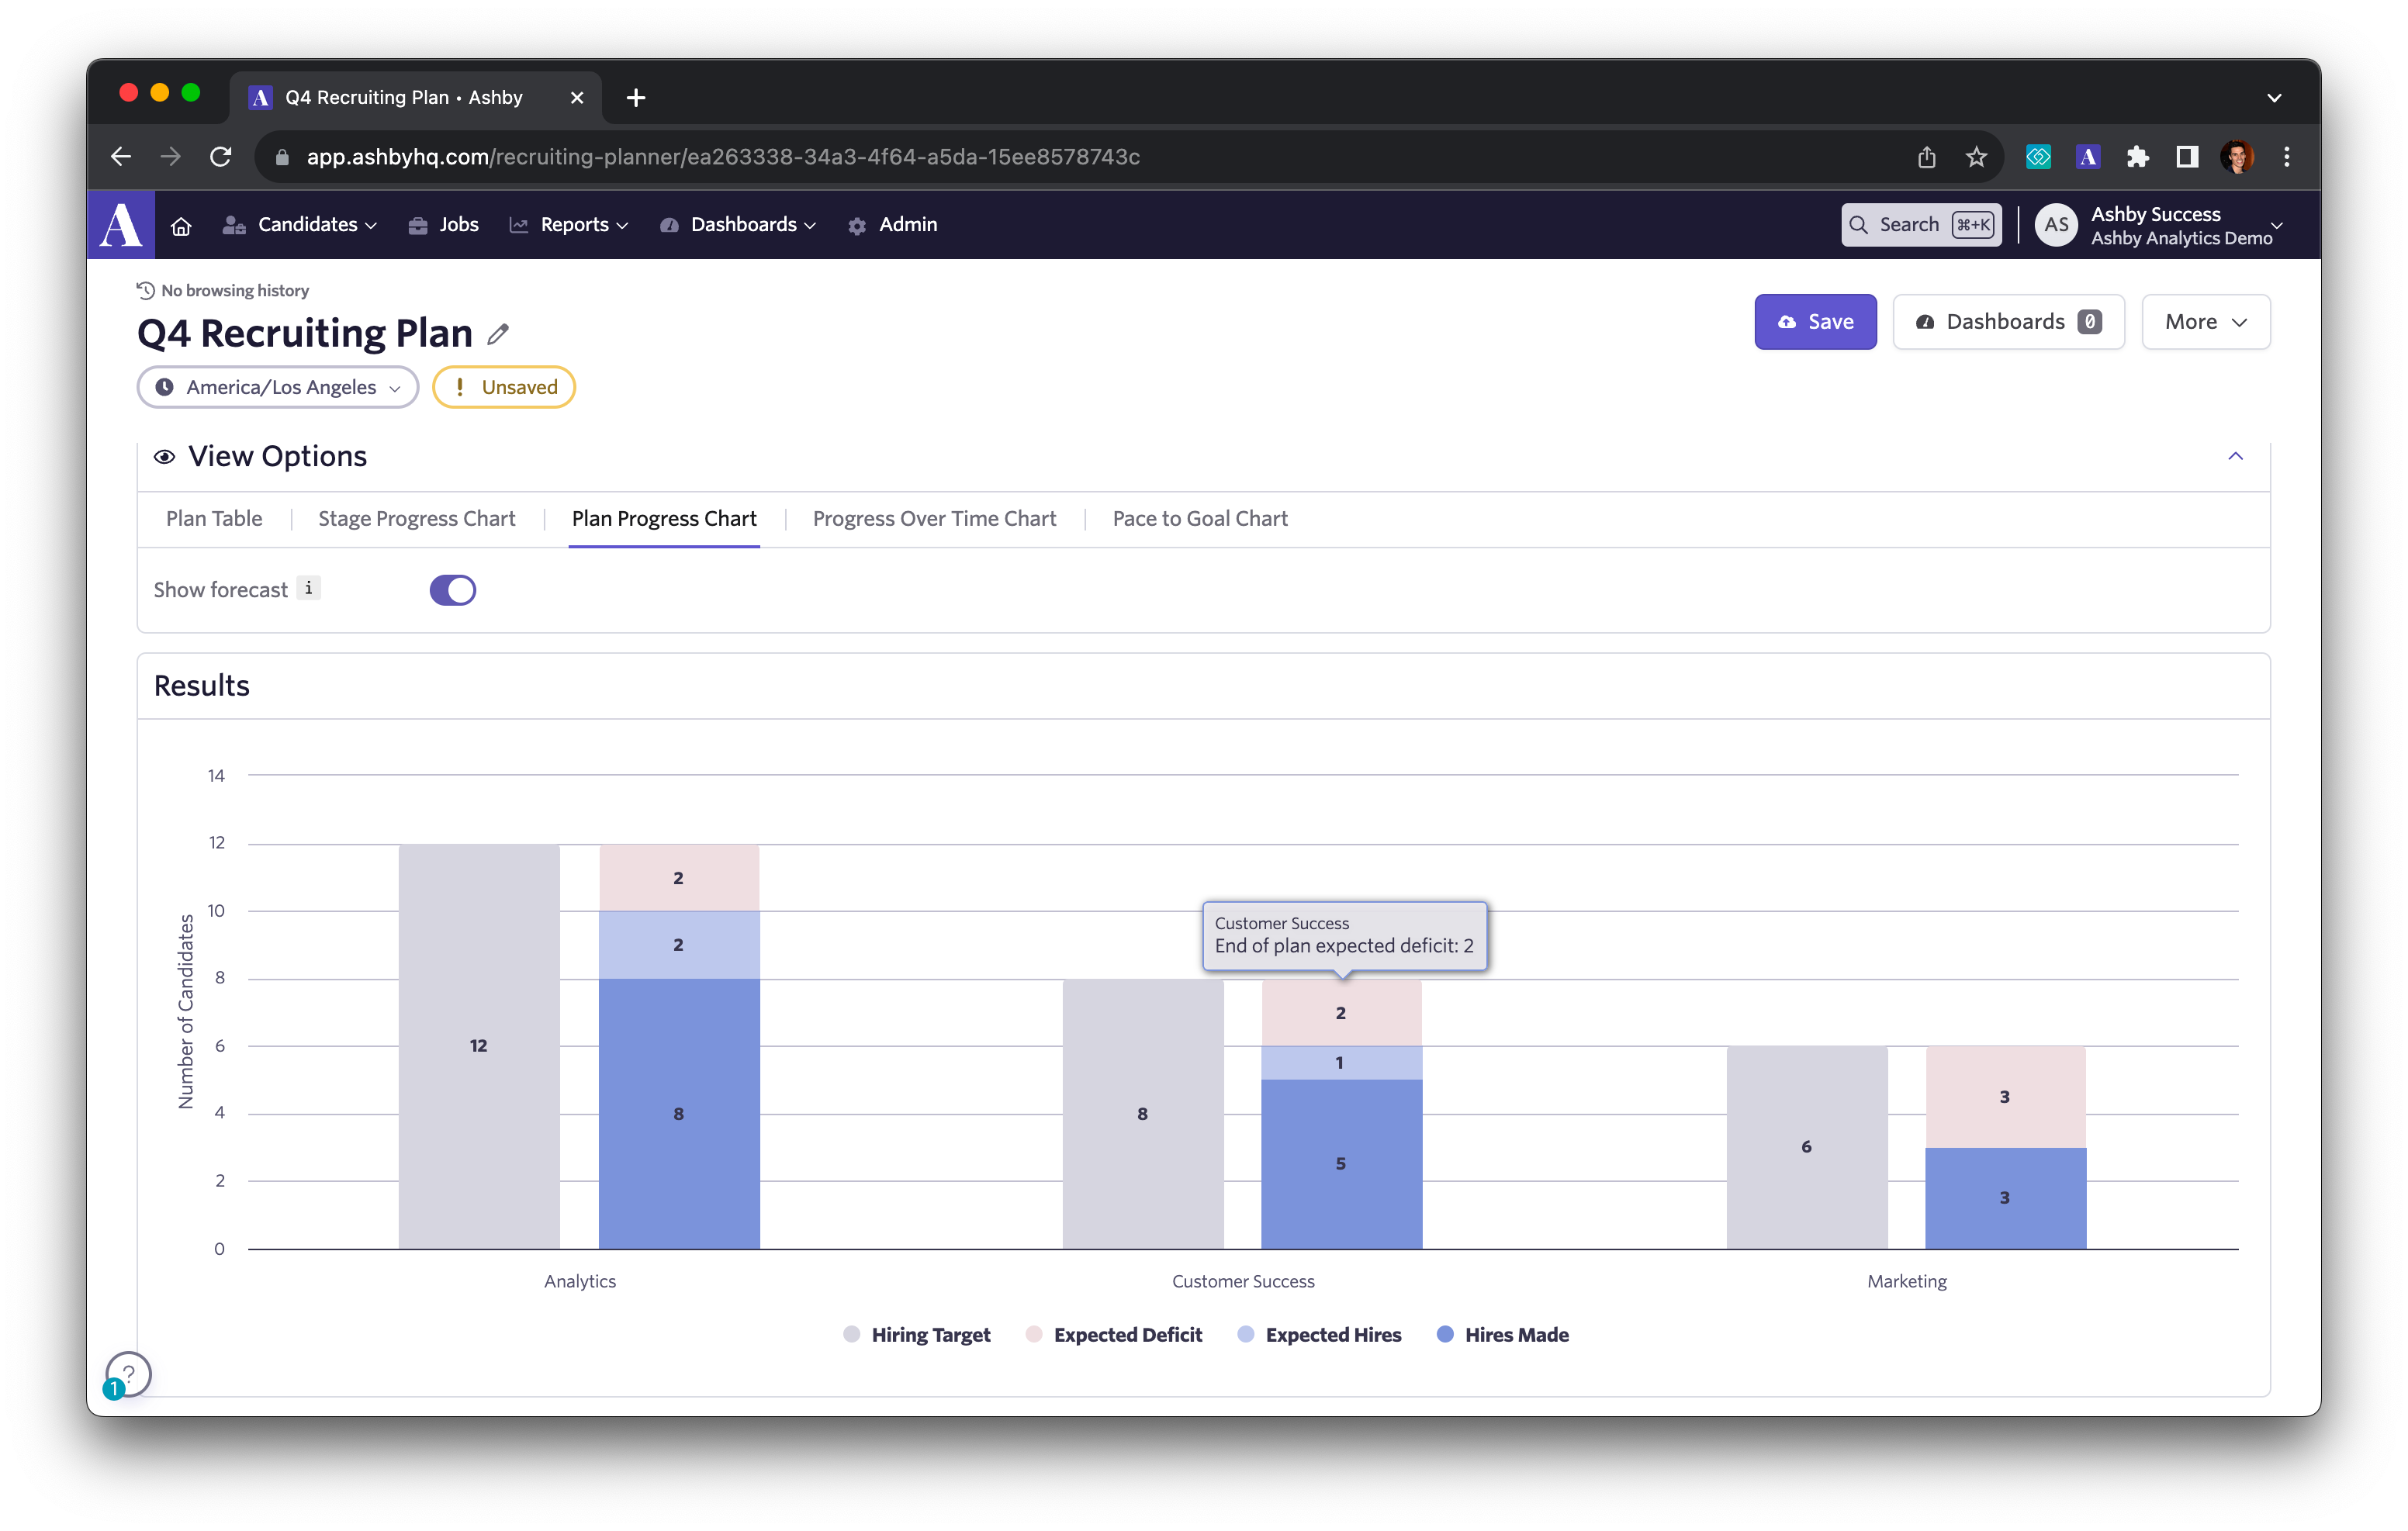
Plan Progress
The plan progress chart shows your expected hires and deficit at the end of your plan. By focusing on expected hiring outcomes, you can engage with your stakeholders to proactively prioritize and troubleshoot where you should focus your efforts in a very simple snapshot.
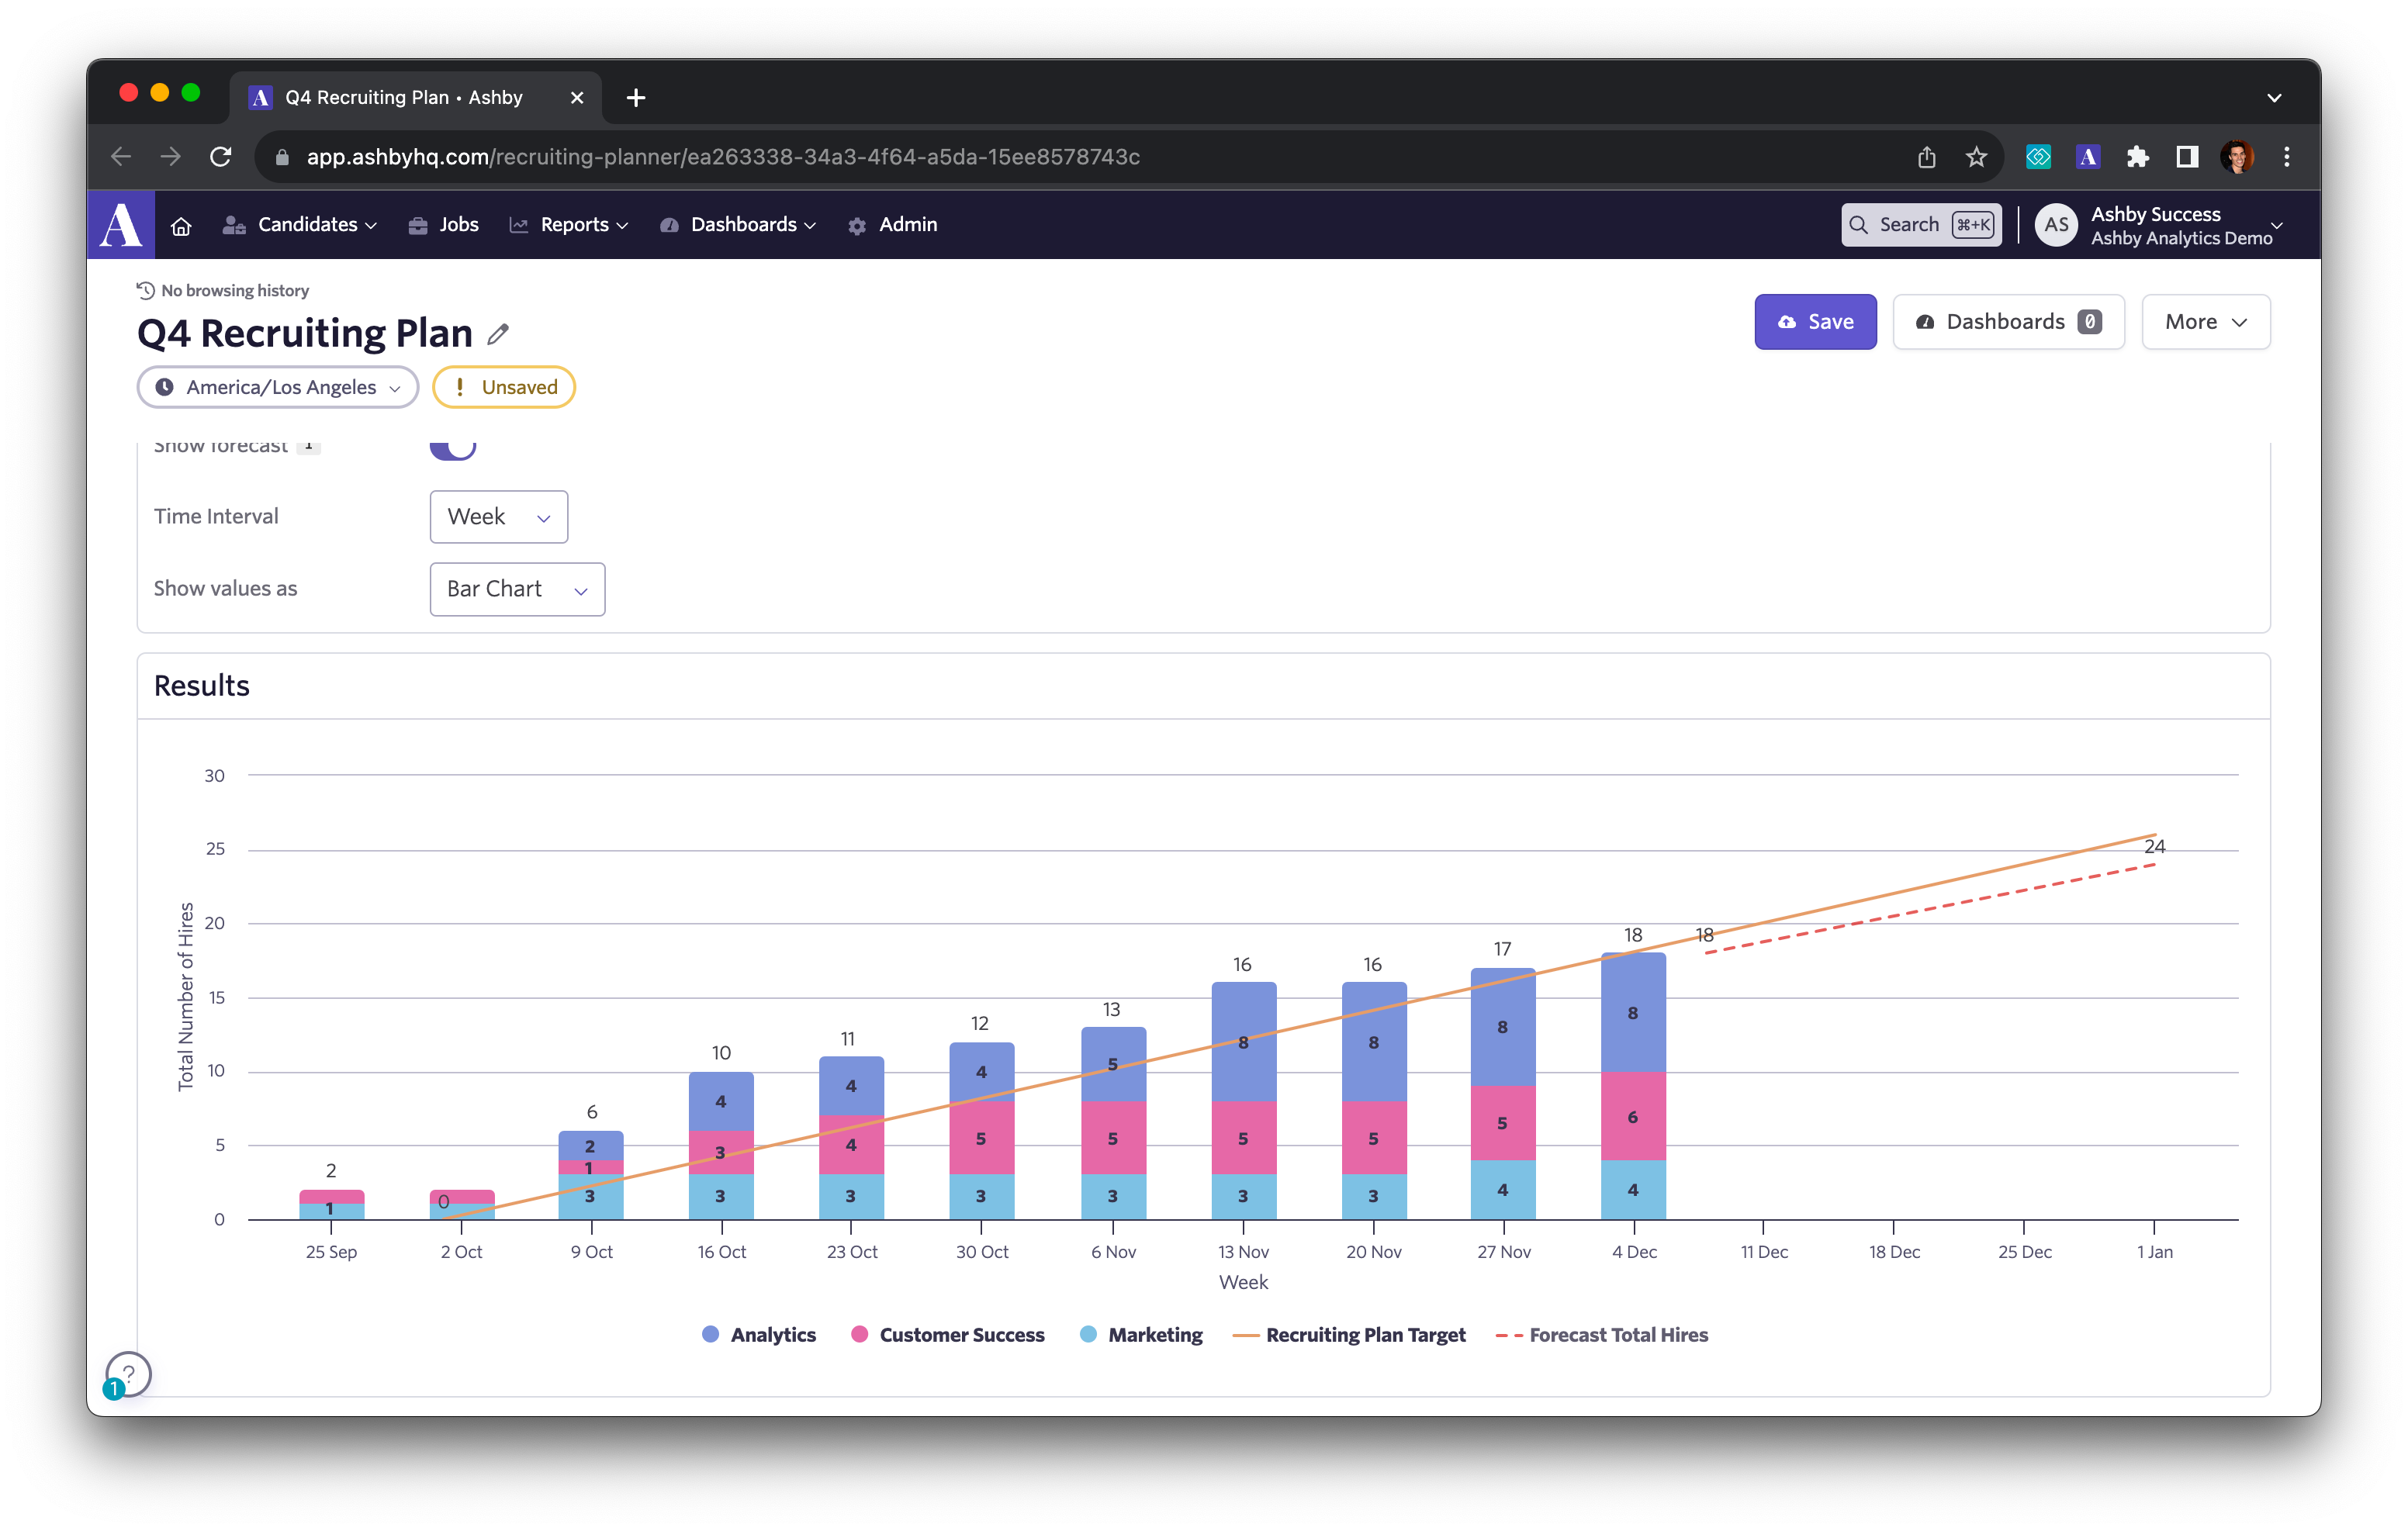
Progress Over Time
See the composition across your hiring plan over time. This visualization gives you an overview of how certain initiatives to remove bottlenecks or dedicate more resources impact your progress over time. The dashed line lets you know where you’re forecasted to end up against your overall hiring plan goal.
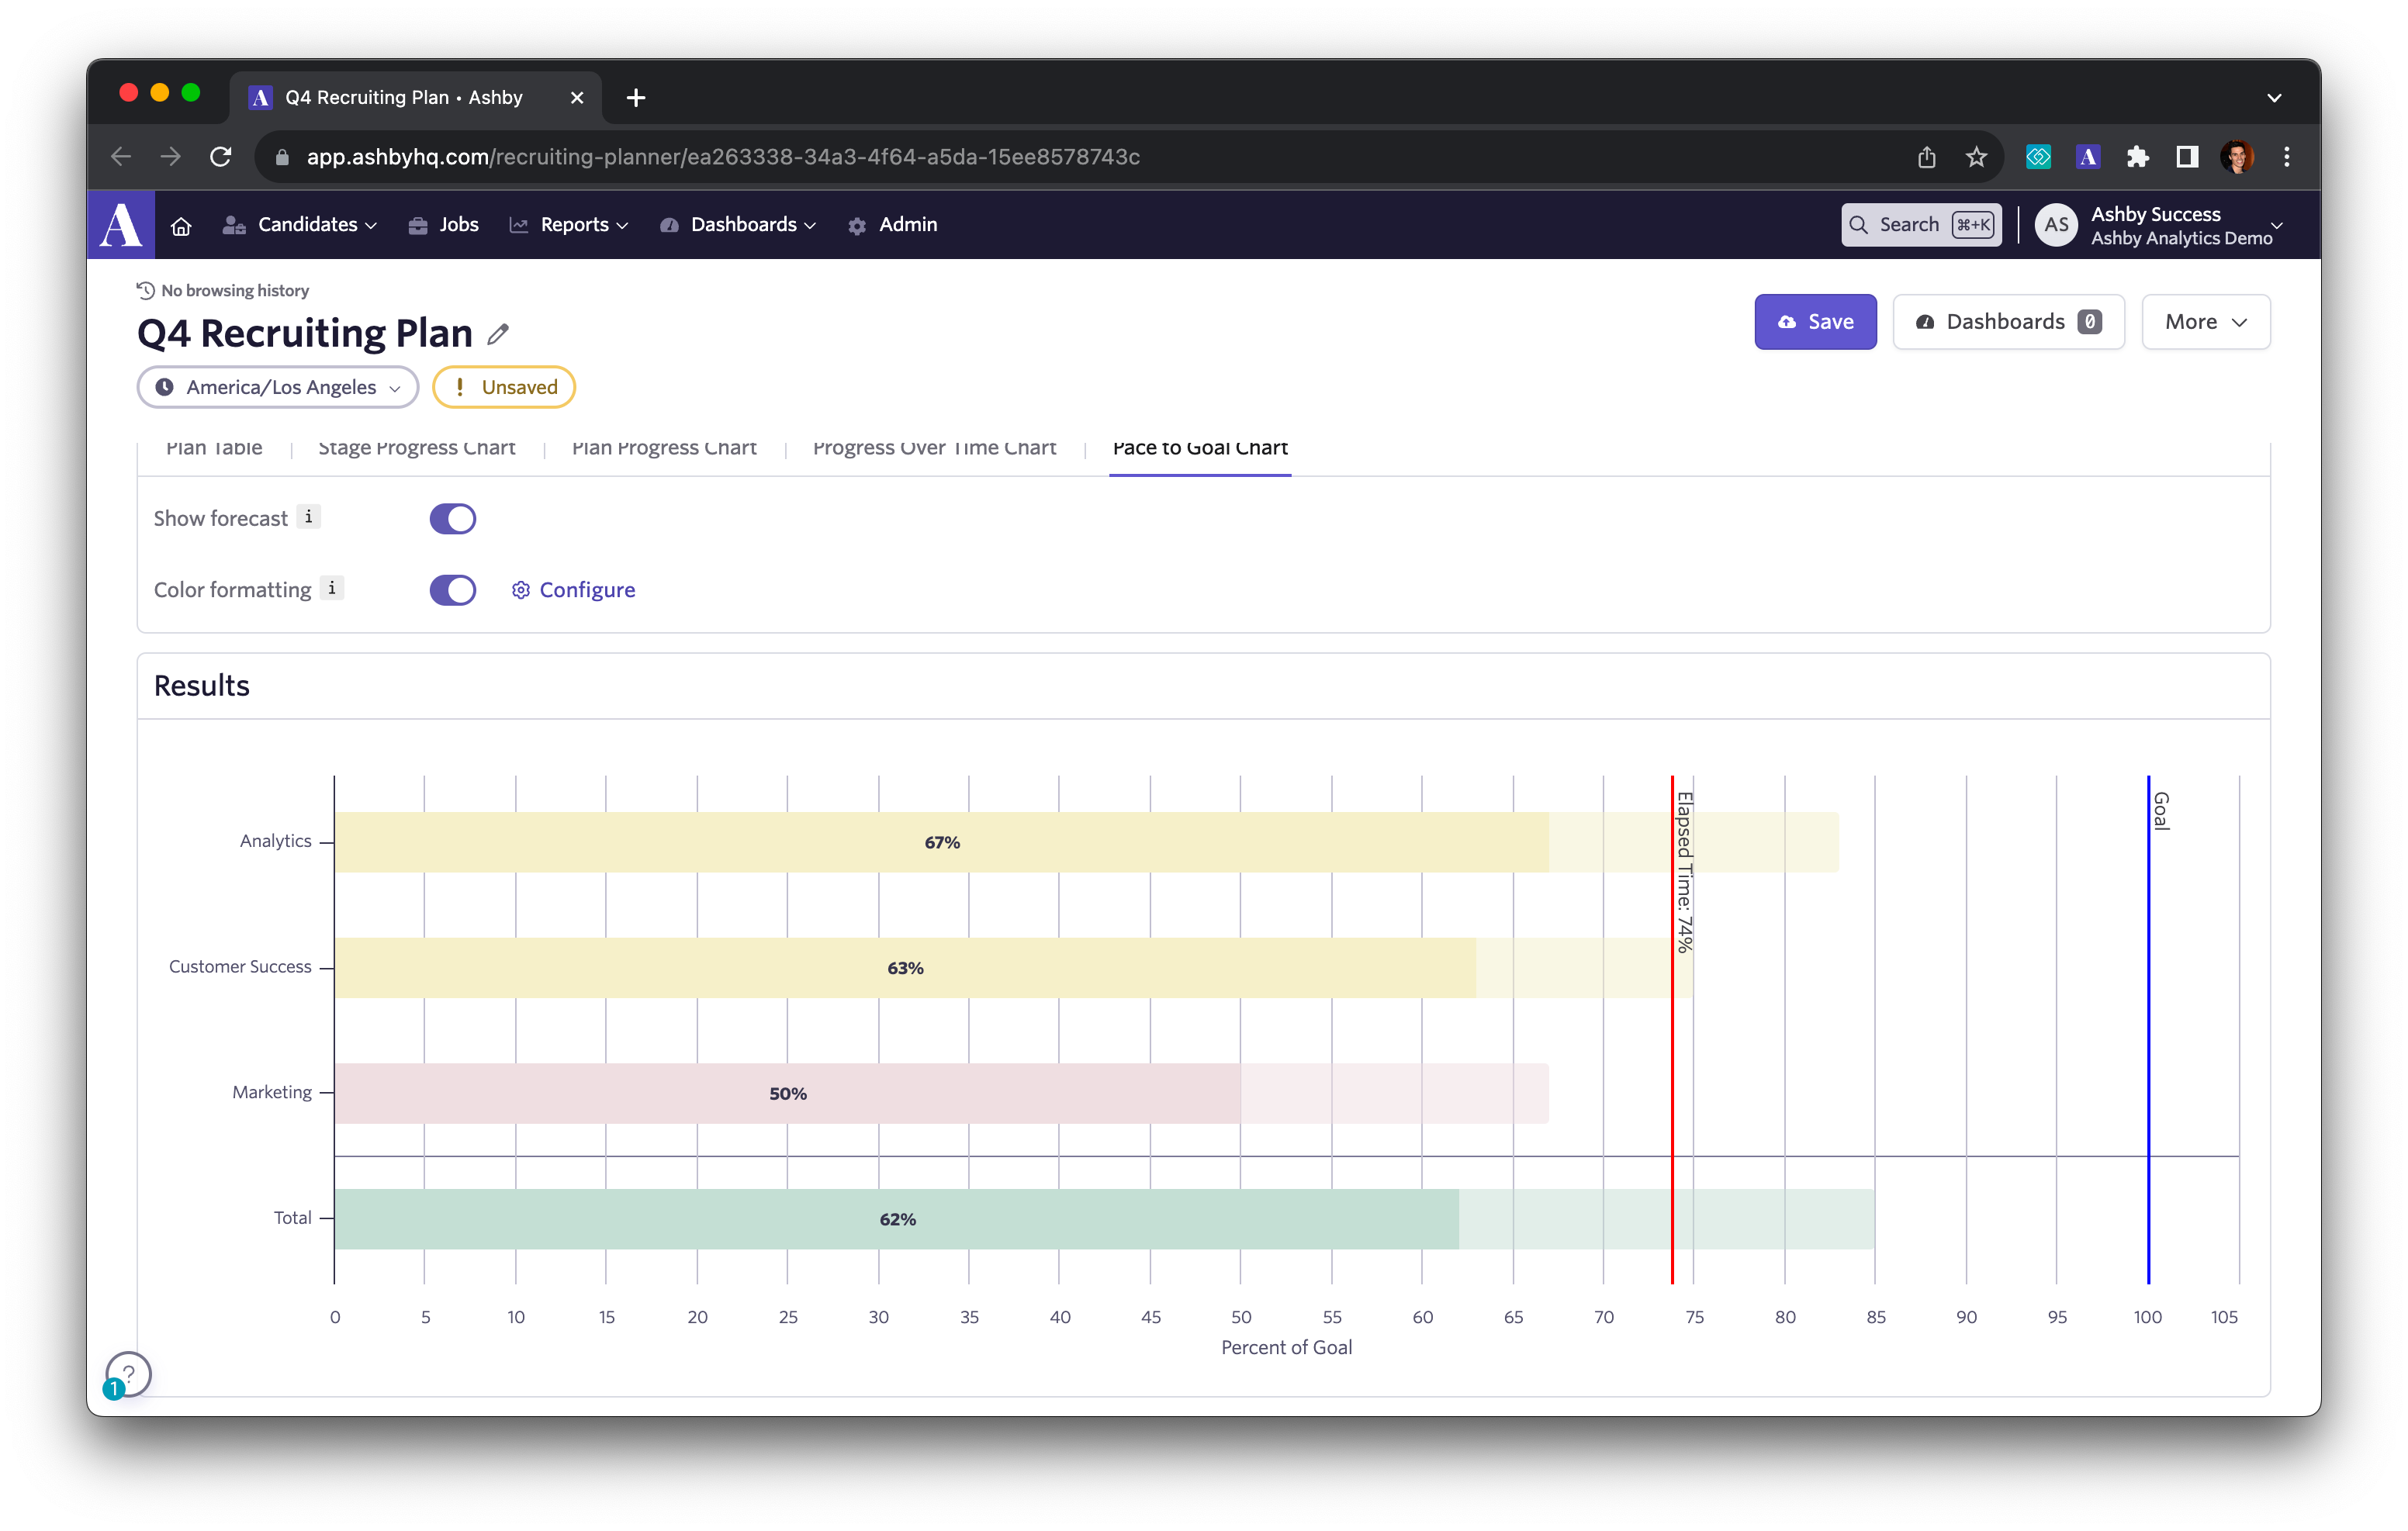
Pace to Goal
The pace to goal visualization is perfect for effectively communicating to stakeholders what’s on track or off track, where you expect to end up, and how much time you have left in your plan.
These latest recruiting planner improvements help you effectively communicate your hiring plans and its progress, enabling more strategic conversations with your stakeholders on what actions you need to take to achieve your goals.
See more details at Ashby University, or get started by heading over to Reports > Templates > Recruiting planner. You can also book a demo if you’re interested in seeing the new recruiting planner visualizations and forecasting tools in Ashby!
Bonus: As you head into planning cycles for 2024 be sure to check out the major improvements we made to analytics in Ashby over the last year by watching our keynote segment.
Watch here as we cover: