Quality of Hire | Talent Trends Report

13 minute read
Topics
Table Of Contents
For years, the default way to measure talent team performance was Time to Fill (TTF). While this metric remains a valuable measure of efficiency, it only shows how fast a seat got filled, not whether the right person filled it. Rather than relying on lagging indicators like promotions and performance reviews (which often sit outside the Talent team), Quality of Hire is increasingly becoming the new north star metric: a fast, direct signal of whether a hire is actually working out. As Laura Barnes, VP of Recruiting at Flock, put it:
"While you should absolutely have an SLA around TTF, I didn't feel this accurately represented if you were hiring the right person for the right role. TTF makes recruiters feel that they need to fill a role in 60 days or their job is on the line when really their focus should be 'did I exhaust all options to find the best person.' I started having conversations with our Chief People Officer about what our actual goal is: hiring quality people who are impacting our talent density as an organization."
— Laura Barnes, Vice President of Recruiting at Flock
Talent density is the practice of building a team where every seat is filled with someone who genuinely raises the bar. It's a mindset that favors staying lean over hiring fast and treats every open role as a chance to make the team stronger, not just fuller.
We launched Quality of Hire in 2024 to make this mindset measurable by enabling scaling organizations to have immediate access to a simple and effective approach for measuring performance early in a new hire's tenure. In practice, this means hiring managers receive a short, automated survey at set intervals after a new hire starts (commonly 30, 60, and 90 days) rating how that hire is performing on a 1-5 scale.
Key Findings
- The first Quality of Hire score tells you almost everything you need to know. Hires who start strong tend to stay strong.
- Not all interview feedback carries the same signal. A candidate who earns one standout score from an interviewer often outperforms a candidate who only ever gets safe, consistent ratings.
- Where a candidate comes from has some significance. Inbound, sourced, and referred hires perform similarly overall, but referrals are more likely to land in the top bucket of the scale.
Let's dig in.
Most Hires Meet or Exceed Expectations
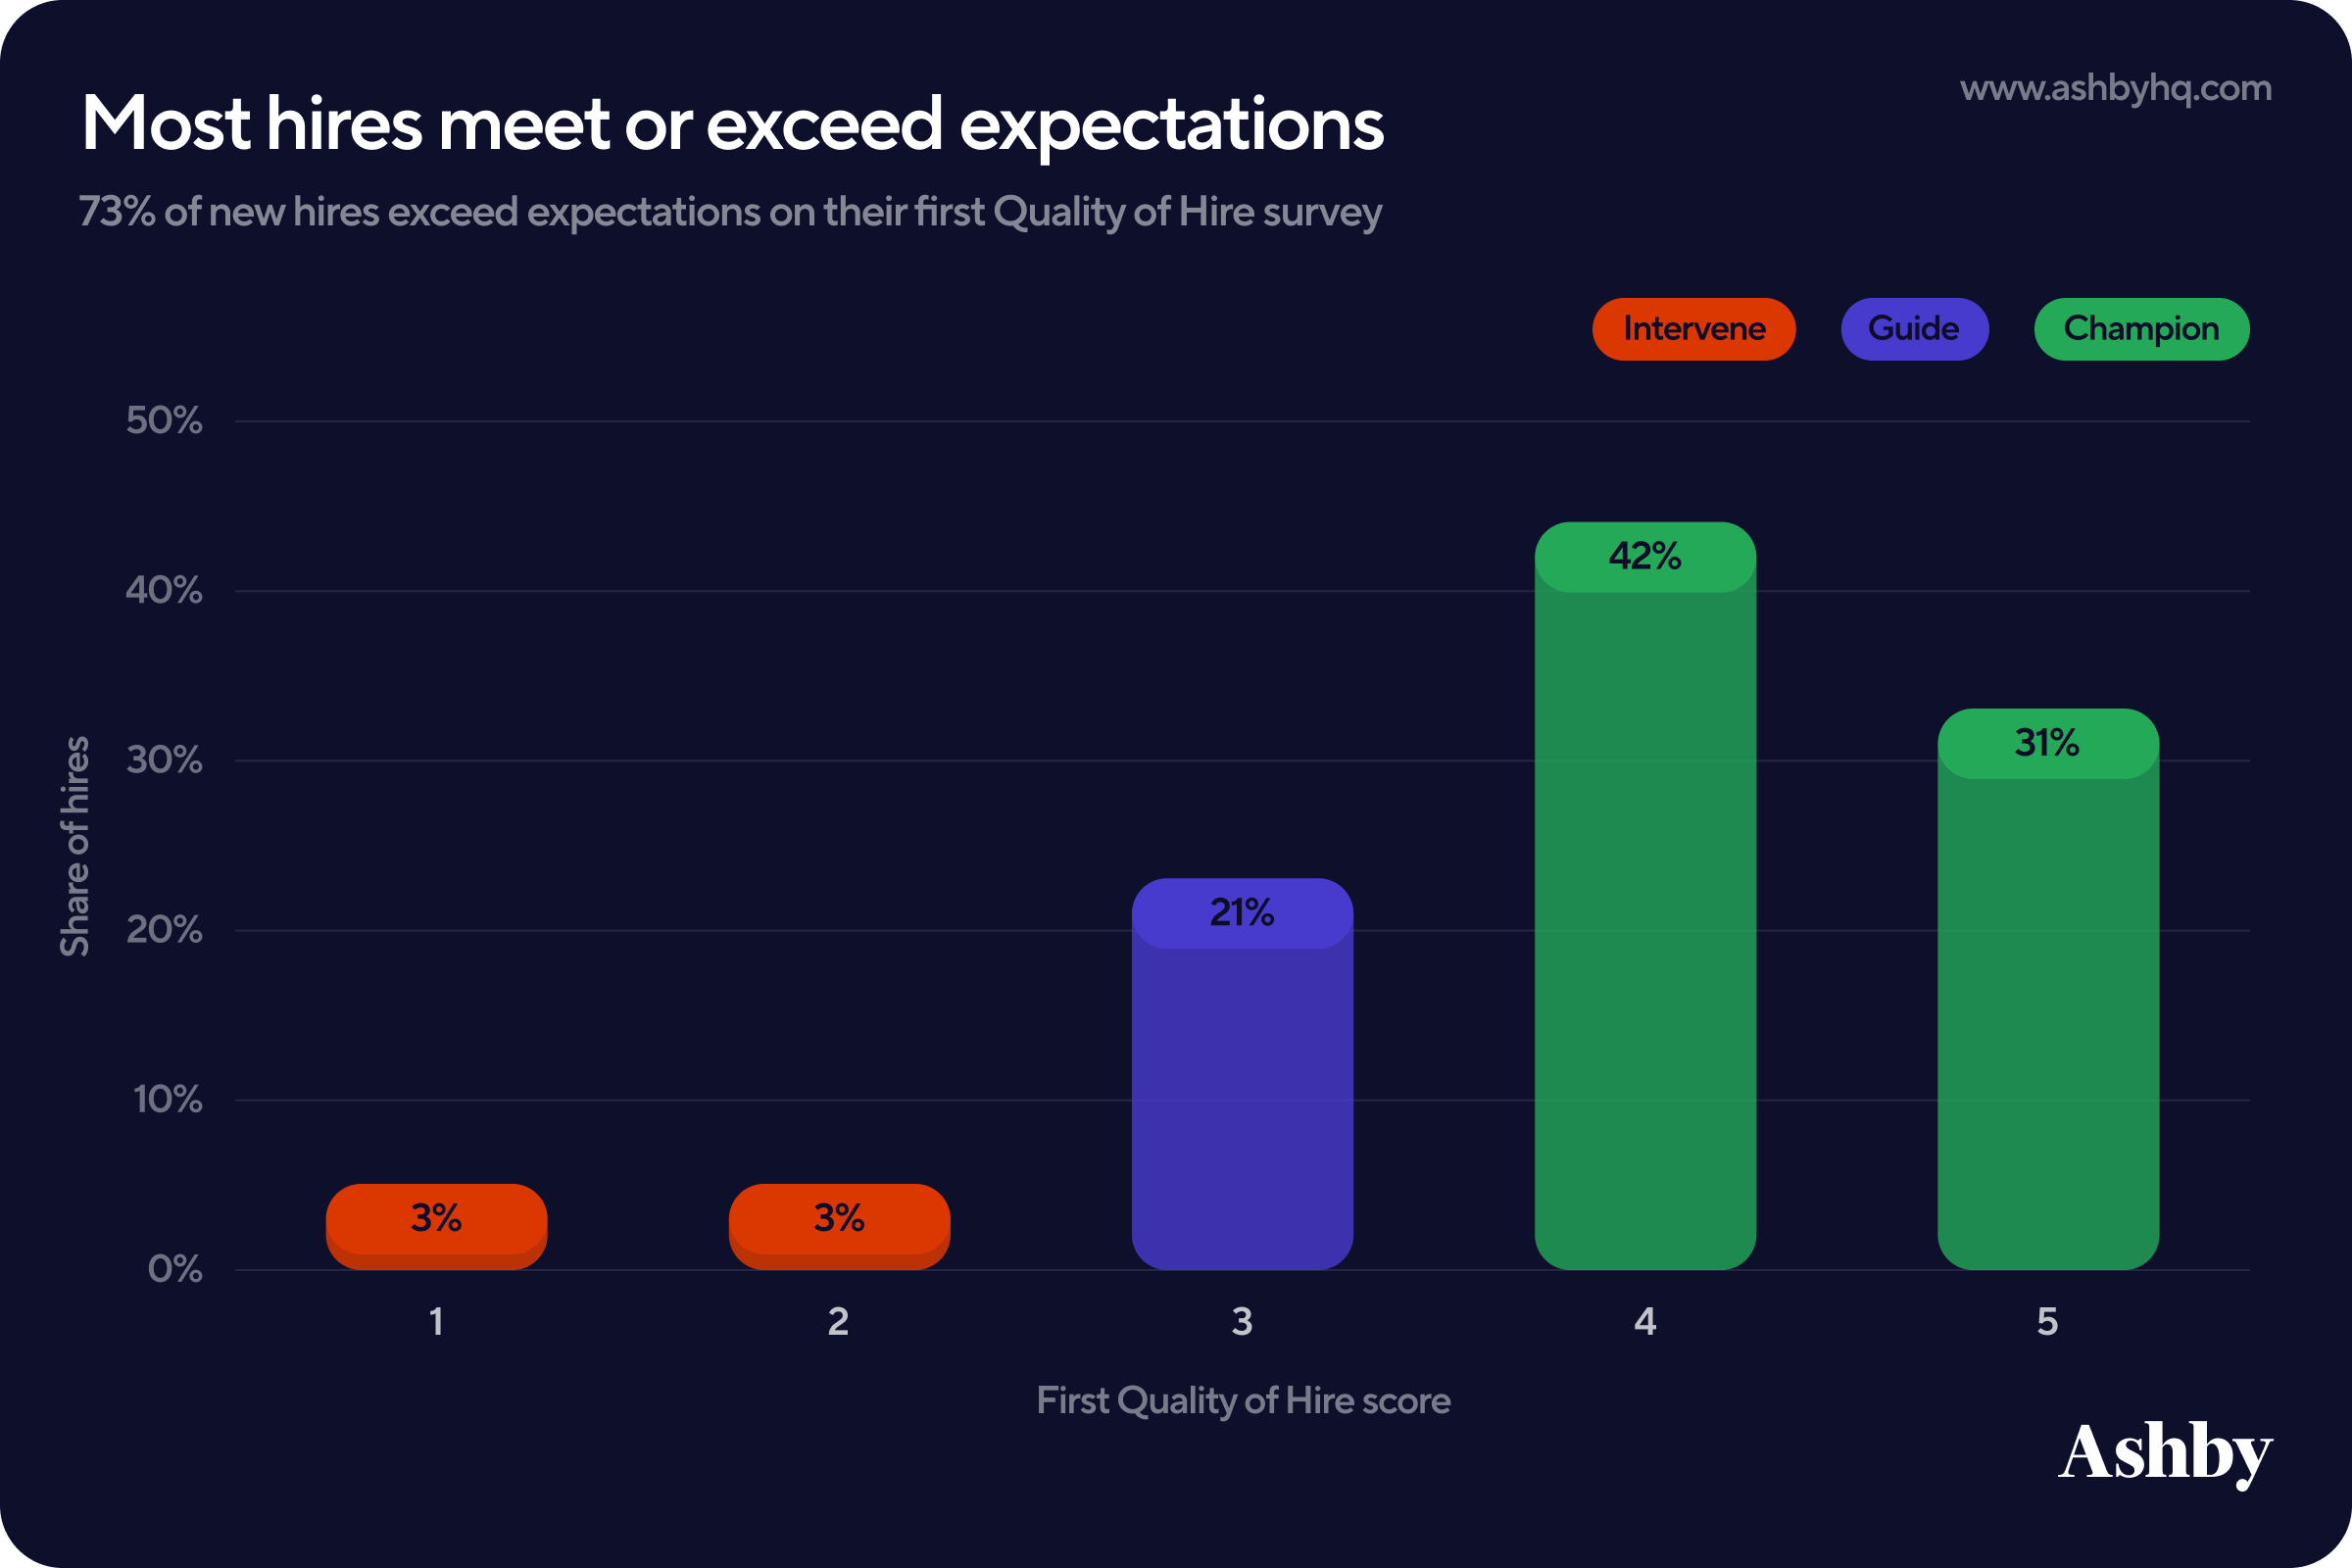
Ashby's Quality of Hire is measured on a 1-5 scale. Our general recommendation is to treat a three as "Meets Expectations," with 1-2 failing to meet and 4-5 exceeding. We see that most scores land on the higher end:
- Most (93%) of first scores fall between 3 and 5
- Nearly three-quarters of hires (73%) exceed expectations
- A third (31%) land in the top score of 5
To us, this suggests that in aggregate the hiring process is working as desired: Companies are bringing in people who meet or exceed what the role requires.
It's worth noting that some employees may exit a company before a Quality of Hire survey is completed, potentially resulting in a lower bound bias where the lowest scores in this data set are underrepresented. Overall, the data still points to generally strong hiring outcomes.
The distribution helps tell us where scores land; what those scores mean is best shared from the people acting on them. For Laura, Quality of Hire helps both enable trust and identify areas for improvement at Flock.
"Our leaders want a talent dense organization. We aim for all of our teams at Flock to achieve a 4 as their Quality of Hire score. When scores for a department are coming in closer to 3, it does elicit a response from department leaders where they feel the need to insert themselves more into the process to get back on track. When they're seeing a 4 or above, they feel strongly that their hiring managers are bringing in the right people and increasing the density of their organization. We're having less conversations about what do we change, and more about how do we continue to replicate this."
— Laura Barnes, Vice President of Recruiting at Flock
If you've followed our Talent Trends reporting in the past, you'll know we typically segment our findings by business versus technical roles. In this analysis, we found companies are fairly aligned across the two functions, so that segmentation isn't used here. You can assume the same benchmarks apply across all roles. However, when you implement Quality of Hire at your company, we do recommend analyzing your data by department.
Sourcing Channels and Quality of Hire
For the most part, Quality of Hire holds steady across the three most common application sources: inbound, sourced, and referrals. However a candidate finds their way to your pipeline, it's still the hiring team's responsibility to screen and interview well enough to find the best fit among them. That said, referrals carry a modest edge. On average, referred hires land a Quality of Hire score of 4.0, compared to 3.8 for inbound applicants and 3.9 for sourced hires.
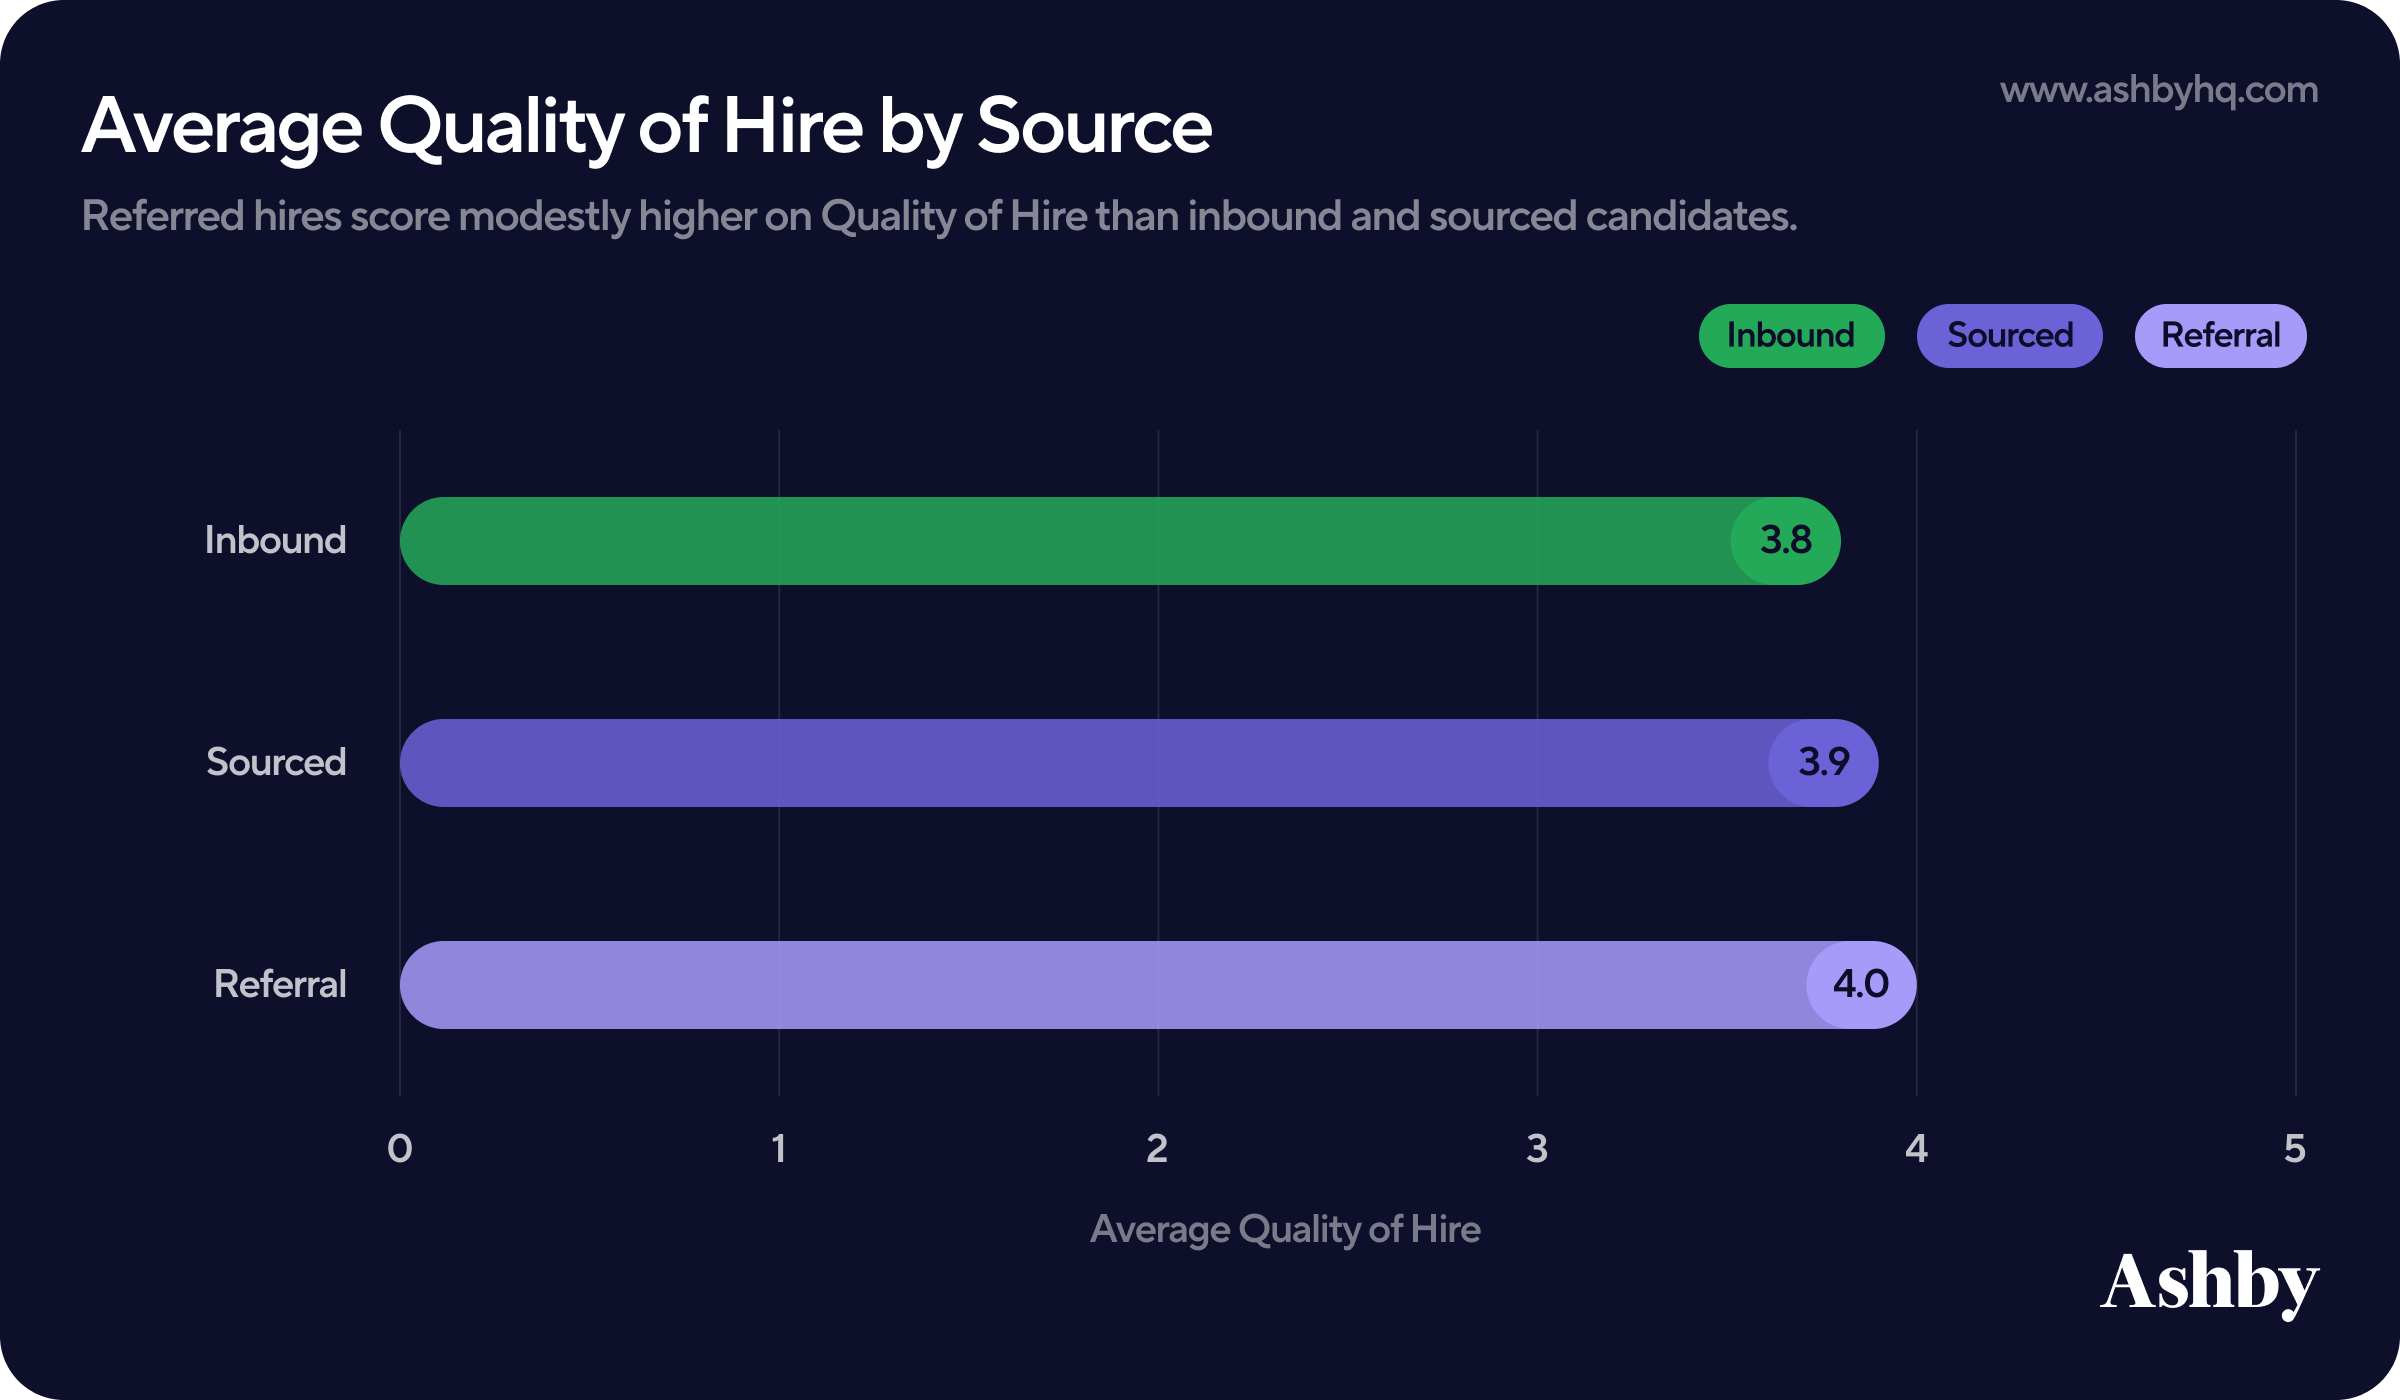
This matches previous findings in our Recruiting Operations report where we touched on how referrals are one of the best ways to tap into your company's existing network, especially when they come from someone in the same job function (i.e. a software engineer referring another software engineer).
That said, averages only tell part of the story here. Quality of Hire is a ranked scale, so two very different distributions of scores can produce a similar average. Looking instead at the full distribution of the scores, referrals pull ahead most clearly at the top of the scale:
- 36% of referred hires land in the "5: Greatly Exceeds Expectations" bucket, compared to 28% for inbound and 32% for sourced.
- This gap is offset by fewer referrals scoring a 3 — 17% for referral, 21% for sourced, and 23% for inbound.
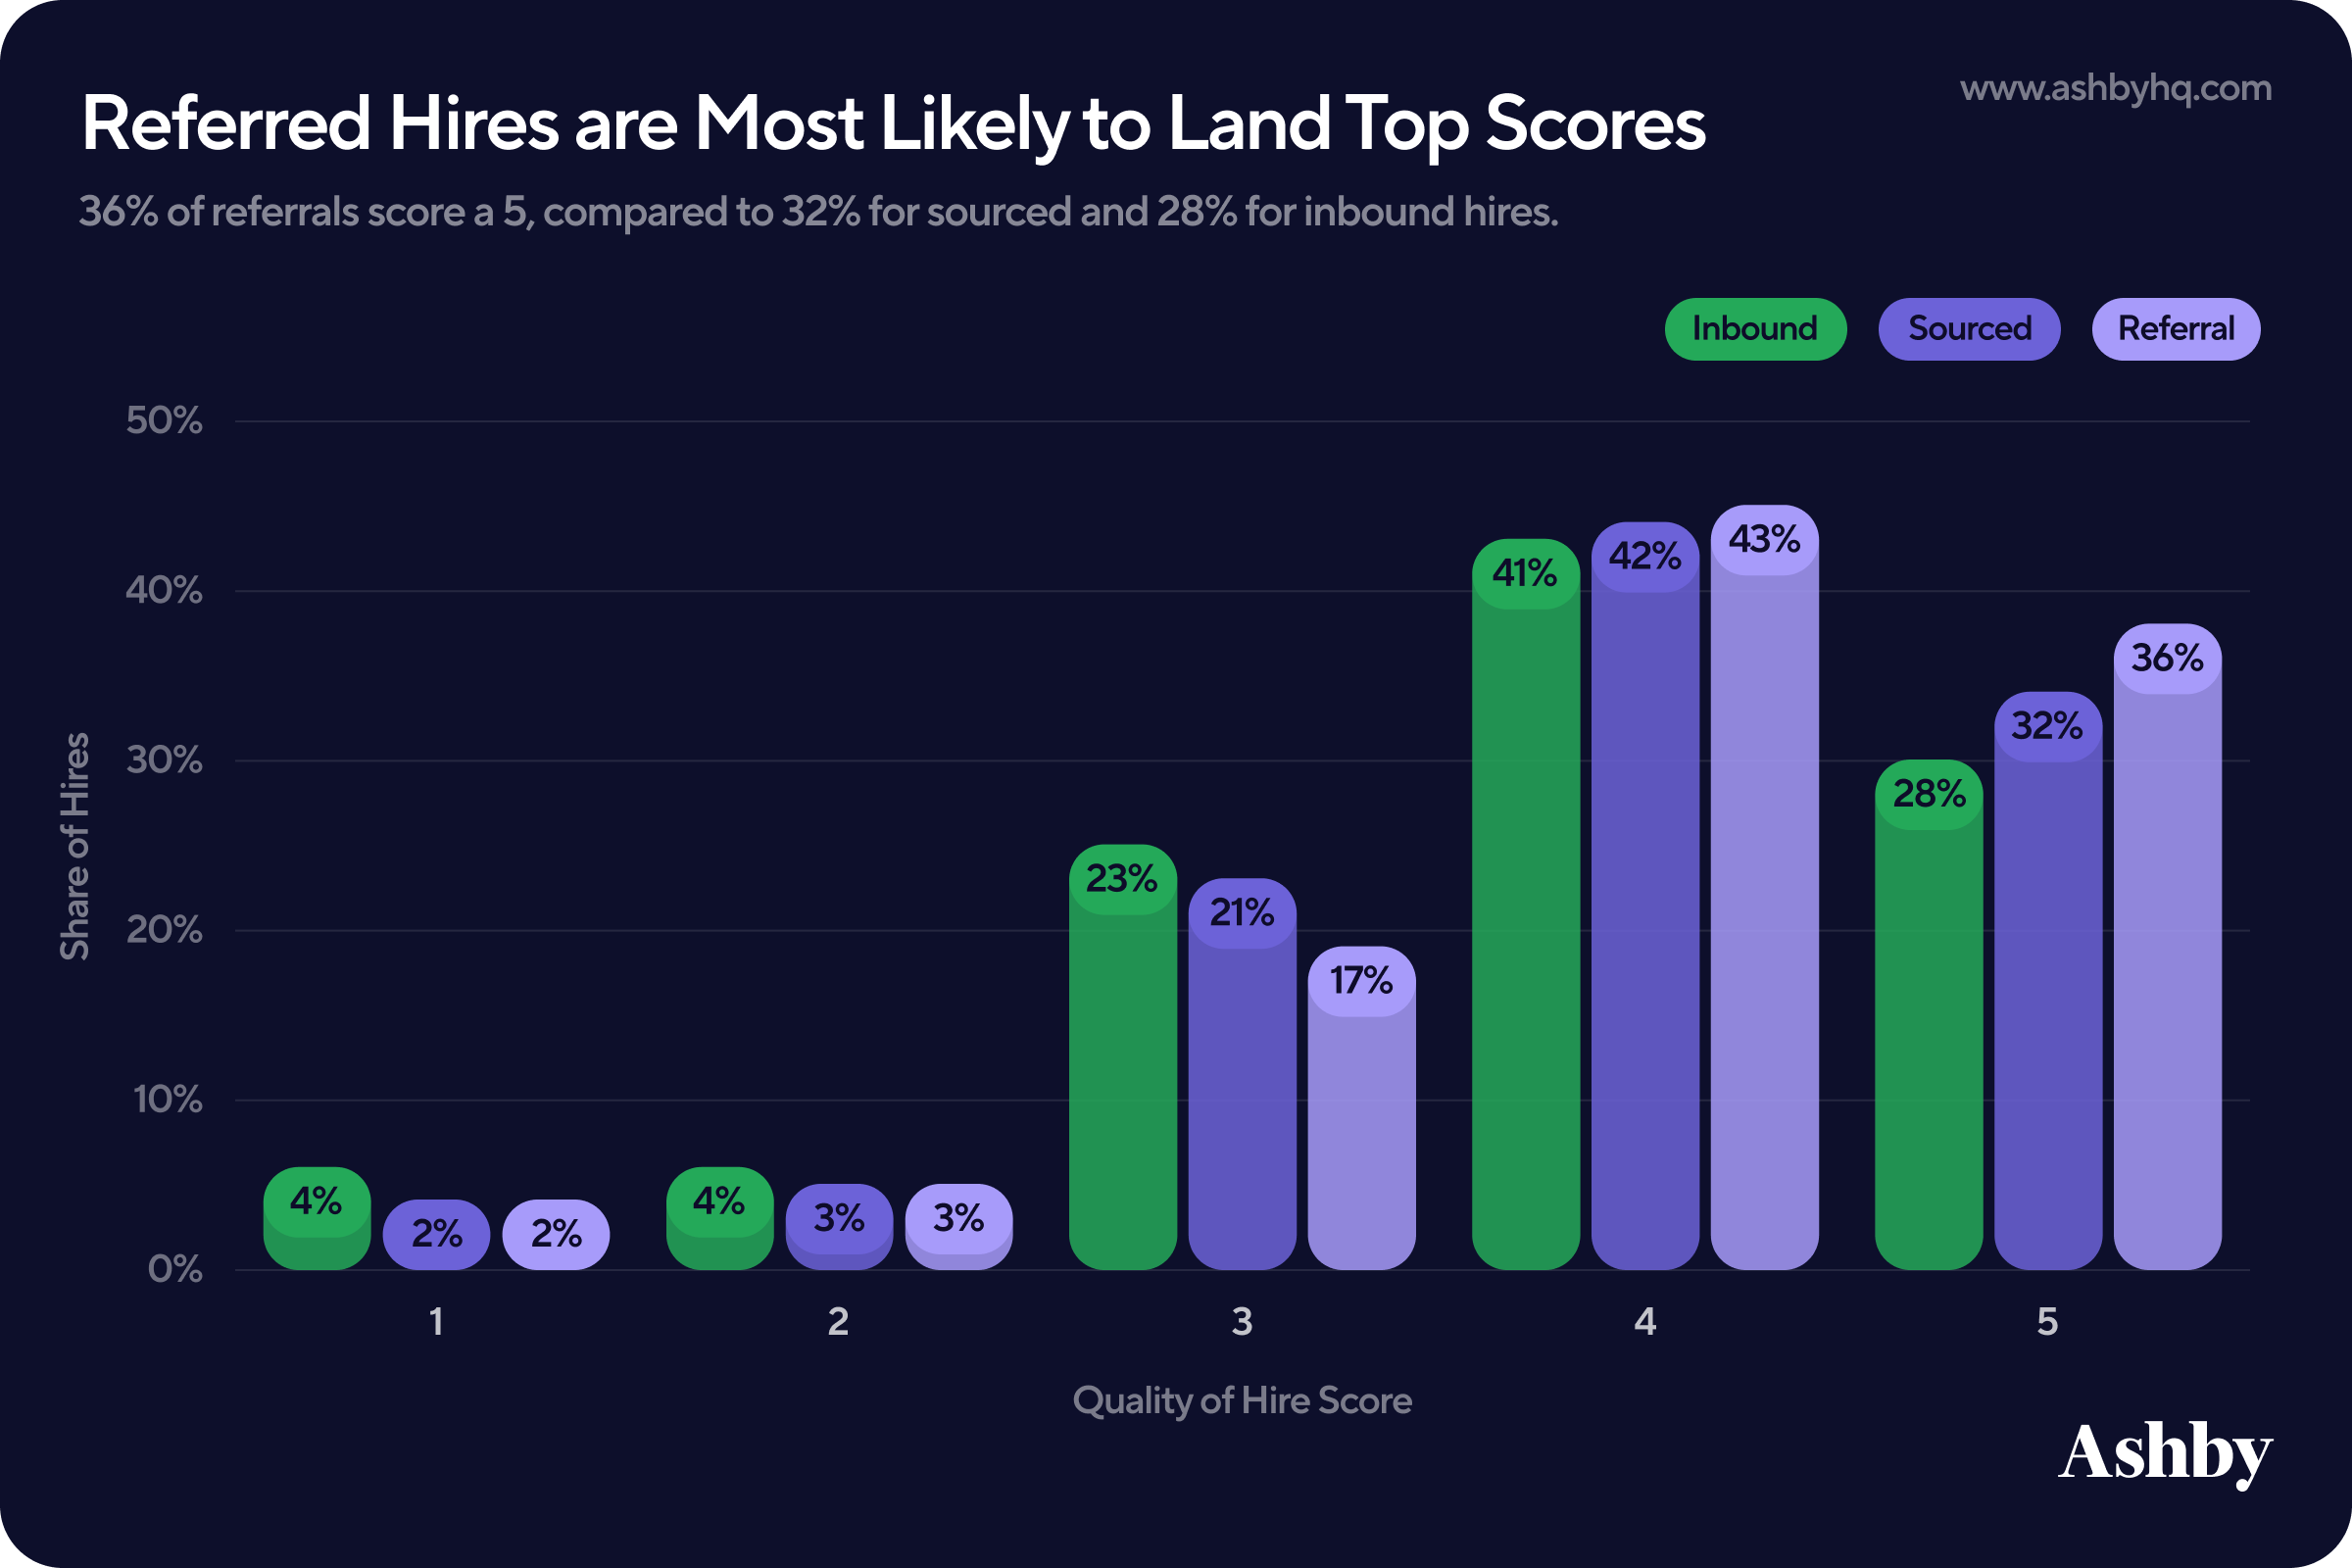
Overall, this doesn't clearly indicate that any channel is lower quality than others. In fact, in speaking to talent leaders directly over hundreds of calls, we find that different companies have different underlying trends where one source may consistently outperform another.
At Ashby One in San Francisco this year, Tim Chattaway, Director of Talent Acquisition at Sony Sports Technology, spoke to how important it is for businesses to look at Quality of Hire by application source. In his instance, he found clear areas where the team needed to stop sourcing candidates.
"We have data showing certain job boards as our lowest performance indicators for Quality of Hire. If people come through Indeed, for example, they are not usually successful. That's where the data review process becomes highly important for where our team is investing time and resources."
— Tim Chattaway, Director of Talent Acquisition, Sony Sports Technology
What Spiky Scorecards Reveal About Quality of Hire
Every interview in Ashby ends with a scorecard, and each of those scorecards includes a 1-4 feedback rating (note this is a different scale than Quality of Hire, which runs 1-5). We wanted to know how well these ratings predict a candidate's performance once they're actually in the seat.
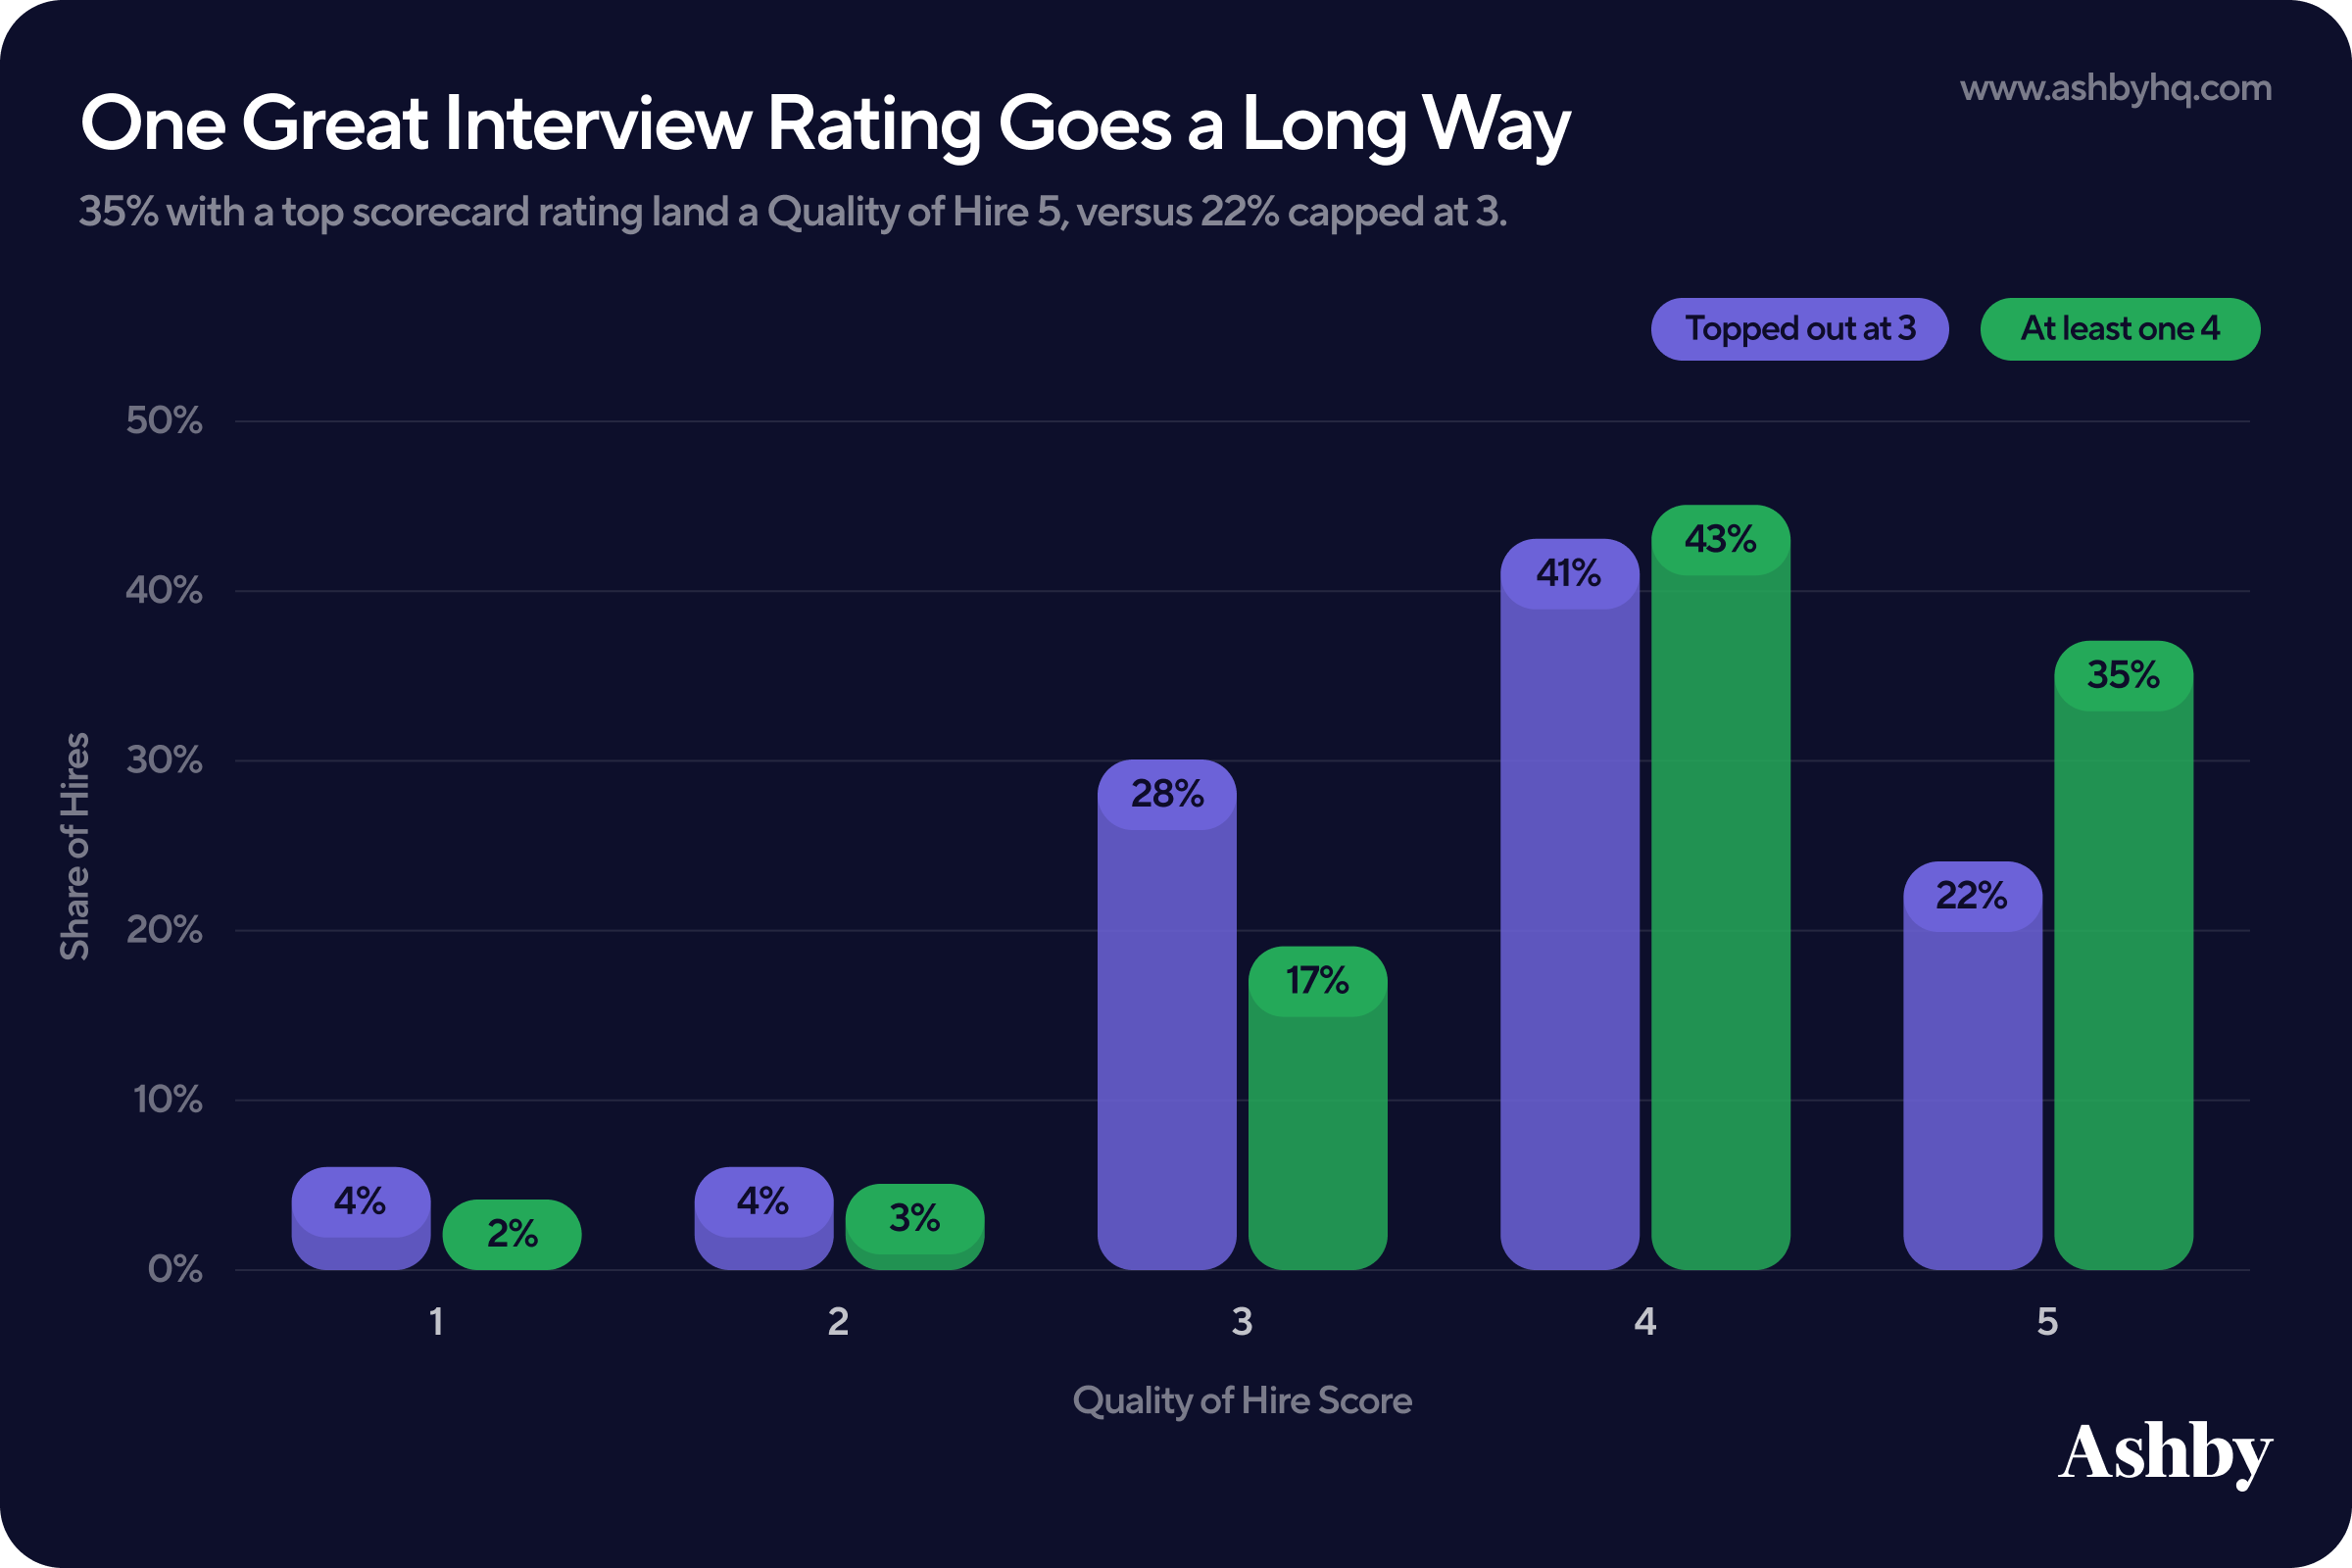
Turns out, having one interviewer strongly advocate for a candidate matters more than having everyone rate them safely at a 3. Candidates who receive at least one 4 average a Quality of Hire score of 4.1, compared to 3.8 for candidates whose highest score, from any interviewer, was a 3.
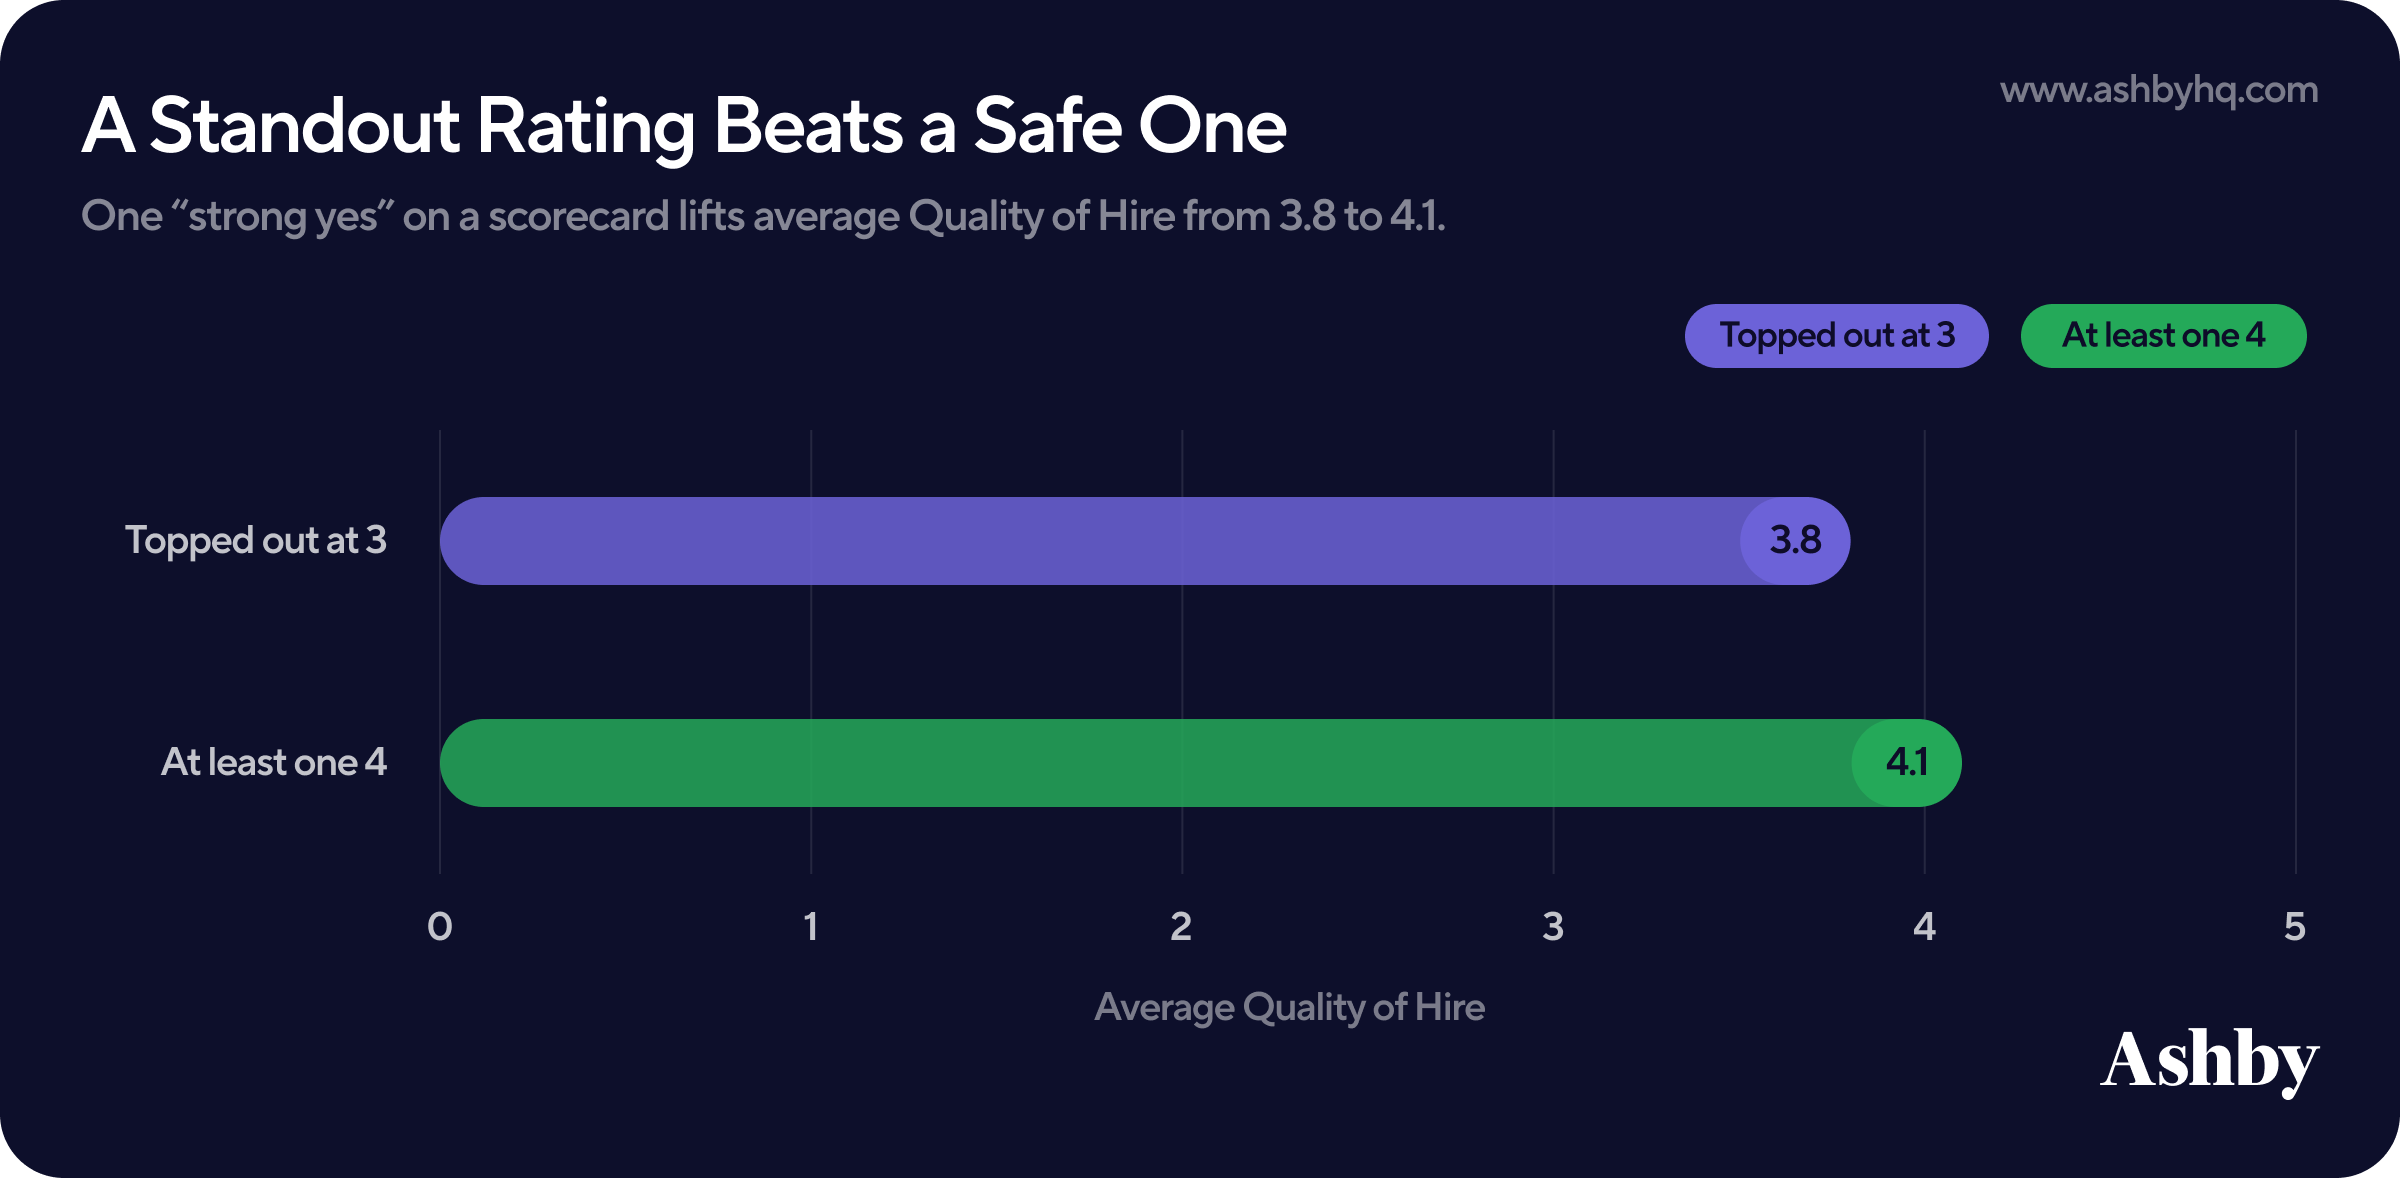
Looking at the full distribution instead of just the average tells a similar story. Candidates who topped out at a 3 across the board are noticeably underrepresented in the top score of 5, and slightly overrepresented in the middle of the scale.
This raised a natural follow-up question: Does this pattern hold even for candidates with a genuinely mixed record? We compared "spiky" candidates, meaning those who received both a 2 and a 4 somewhere in their loop, to candidates who received only 3s and nothing else. We found that spiky candidates average a Quality of Hire score of 4.0 compared to 3.7 for candidates with a uniform string of 3s. In other words, a strong yes carries more signal than a no in the interview process.
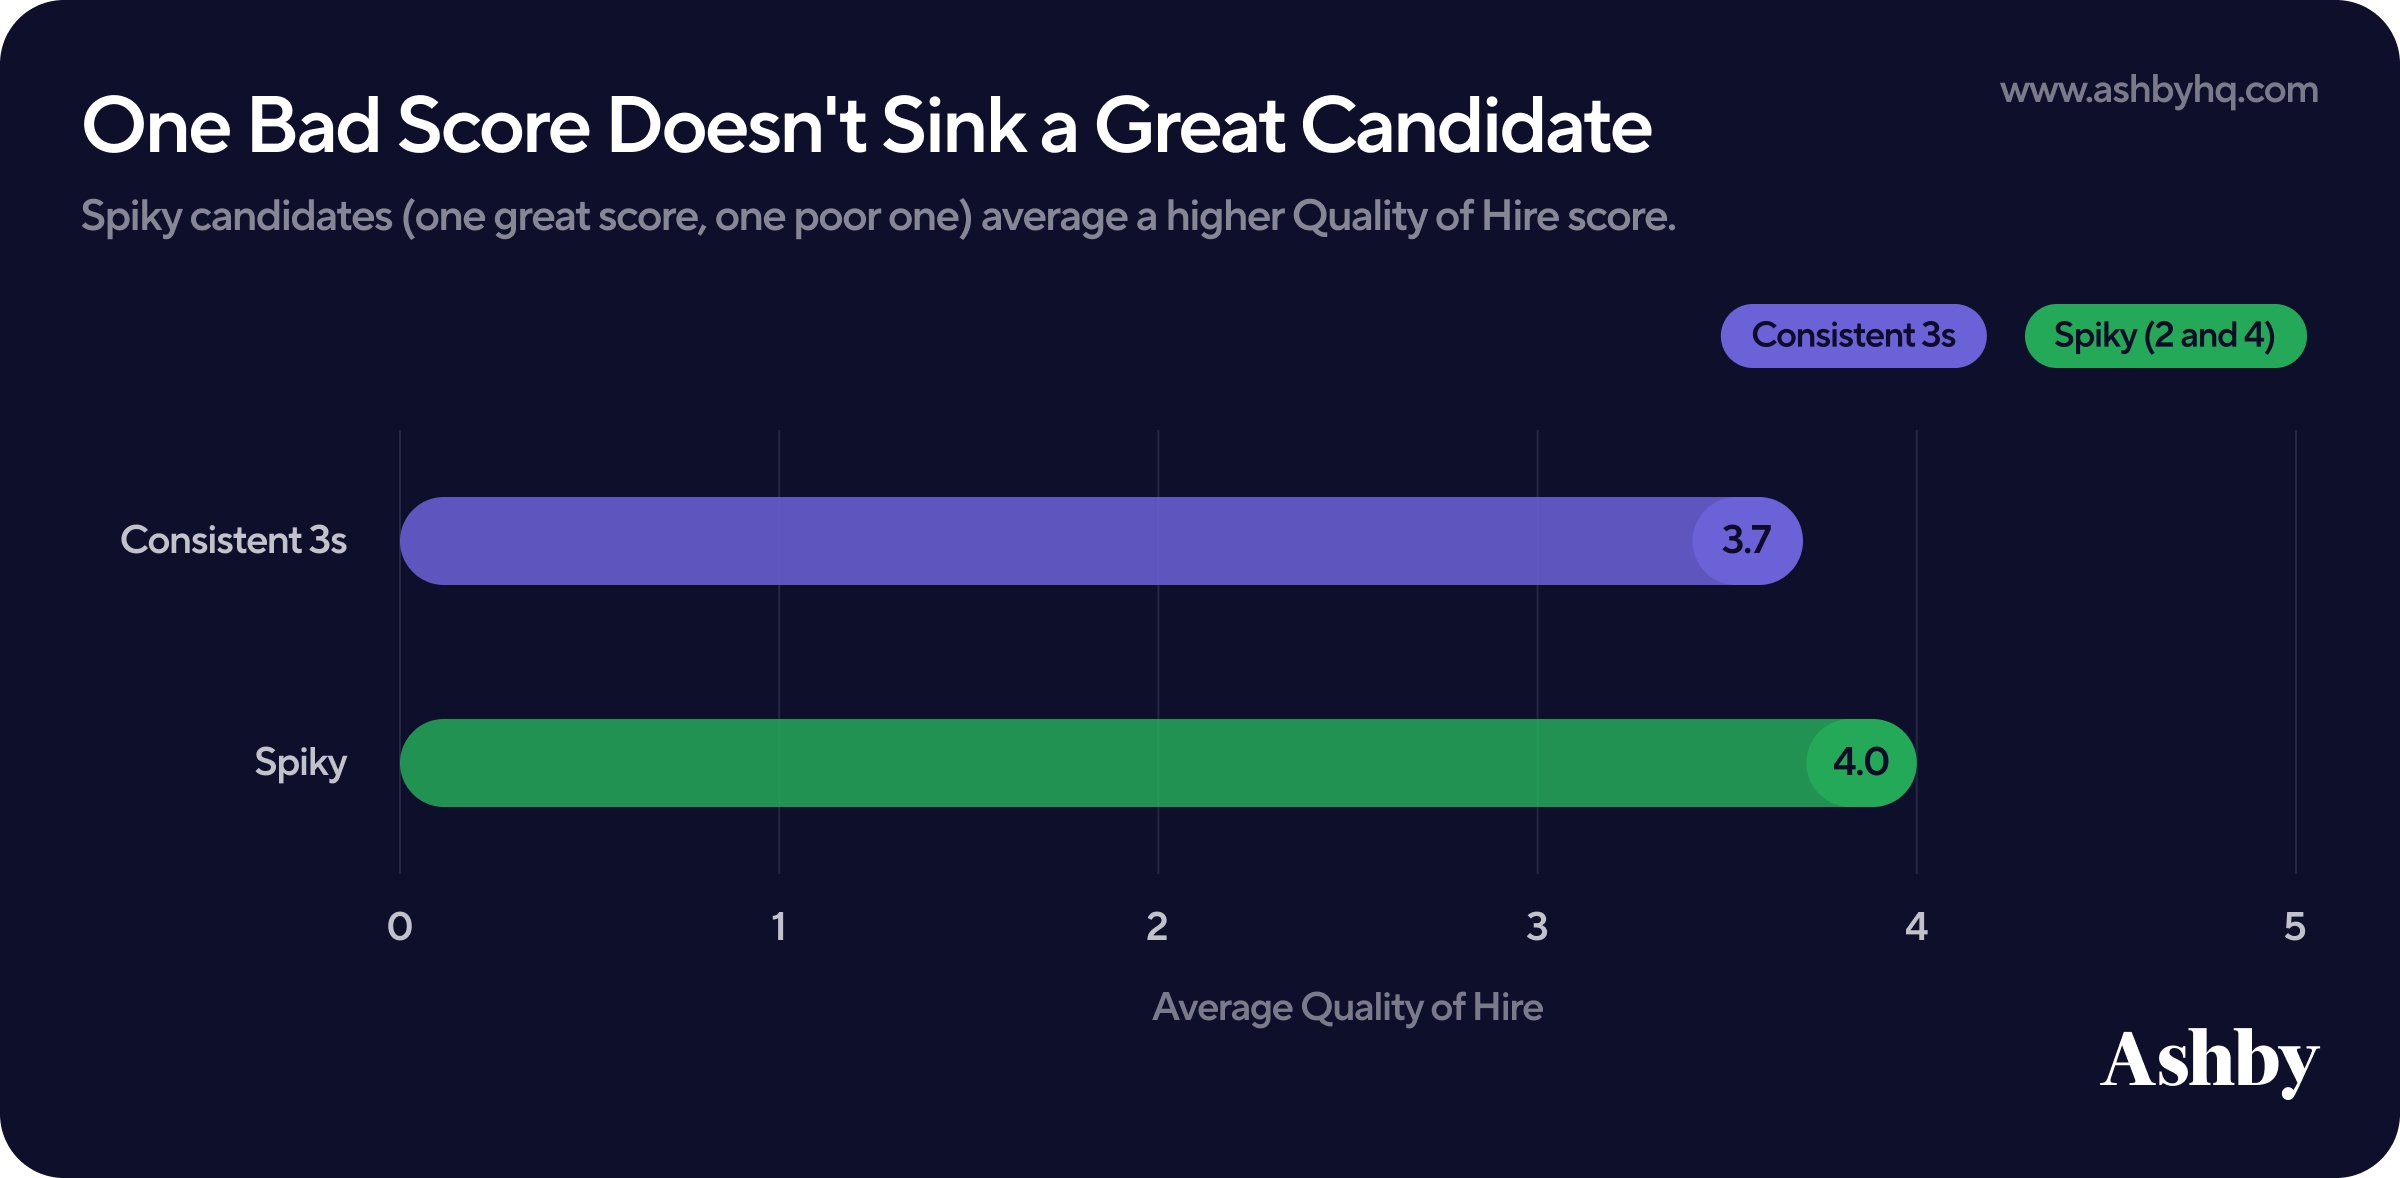
It's also worth noting that very few candidates who receive a 1 from any interviewer go on to be hired at all, so this pattern is really about the 2-4 range versus the full range of possible feedback.
A different perspective on how scorecards and Quality of Hire work together comes from Tim's experience at Sony Sports Technology. Tim found that scorecards were fairly random with multiple interviewers defaulting to a score of 2 or 3, which made them a "yes or no" versus an actual scoring rubric. In overhauling hiring, he added structured debriefs and intakes. But to know if these measures were actually working, he turned to Quality of Hire.
"Everything we did was on the process side. What I needed to actually know was did it work? Did we actually get good hires out of the process improvements we did? Quality of Hire came into Ashby at the perfect time for me. We were able to use it as a qualifier to share back feedback to hiring managers on what was going well and what wasn't. With over two years of Quality of Hire data, now it's becoming really powerful."
— Tim Chattaway, Director of Talent Acquisition, Sony Sports Technology
Quality of Hire as a Predictor of New Hire Performance
Next, we wanted to understand how Quality of Hire changes as new hires settle into their roles. Some candidates struggle early and find their footing later, while others hold steady from day one. What does the data signal about these scenarios?
We found that the first Quality of Hire score is a strong predictor of where a hire ends up, though how predictive it is depends on what that first score actually was.
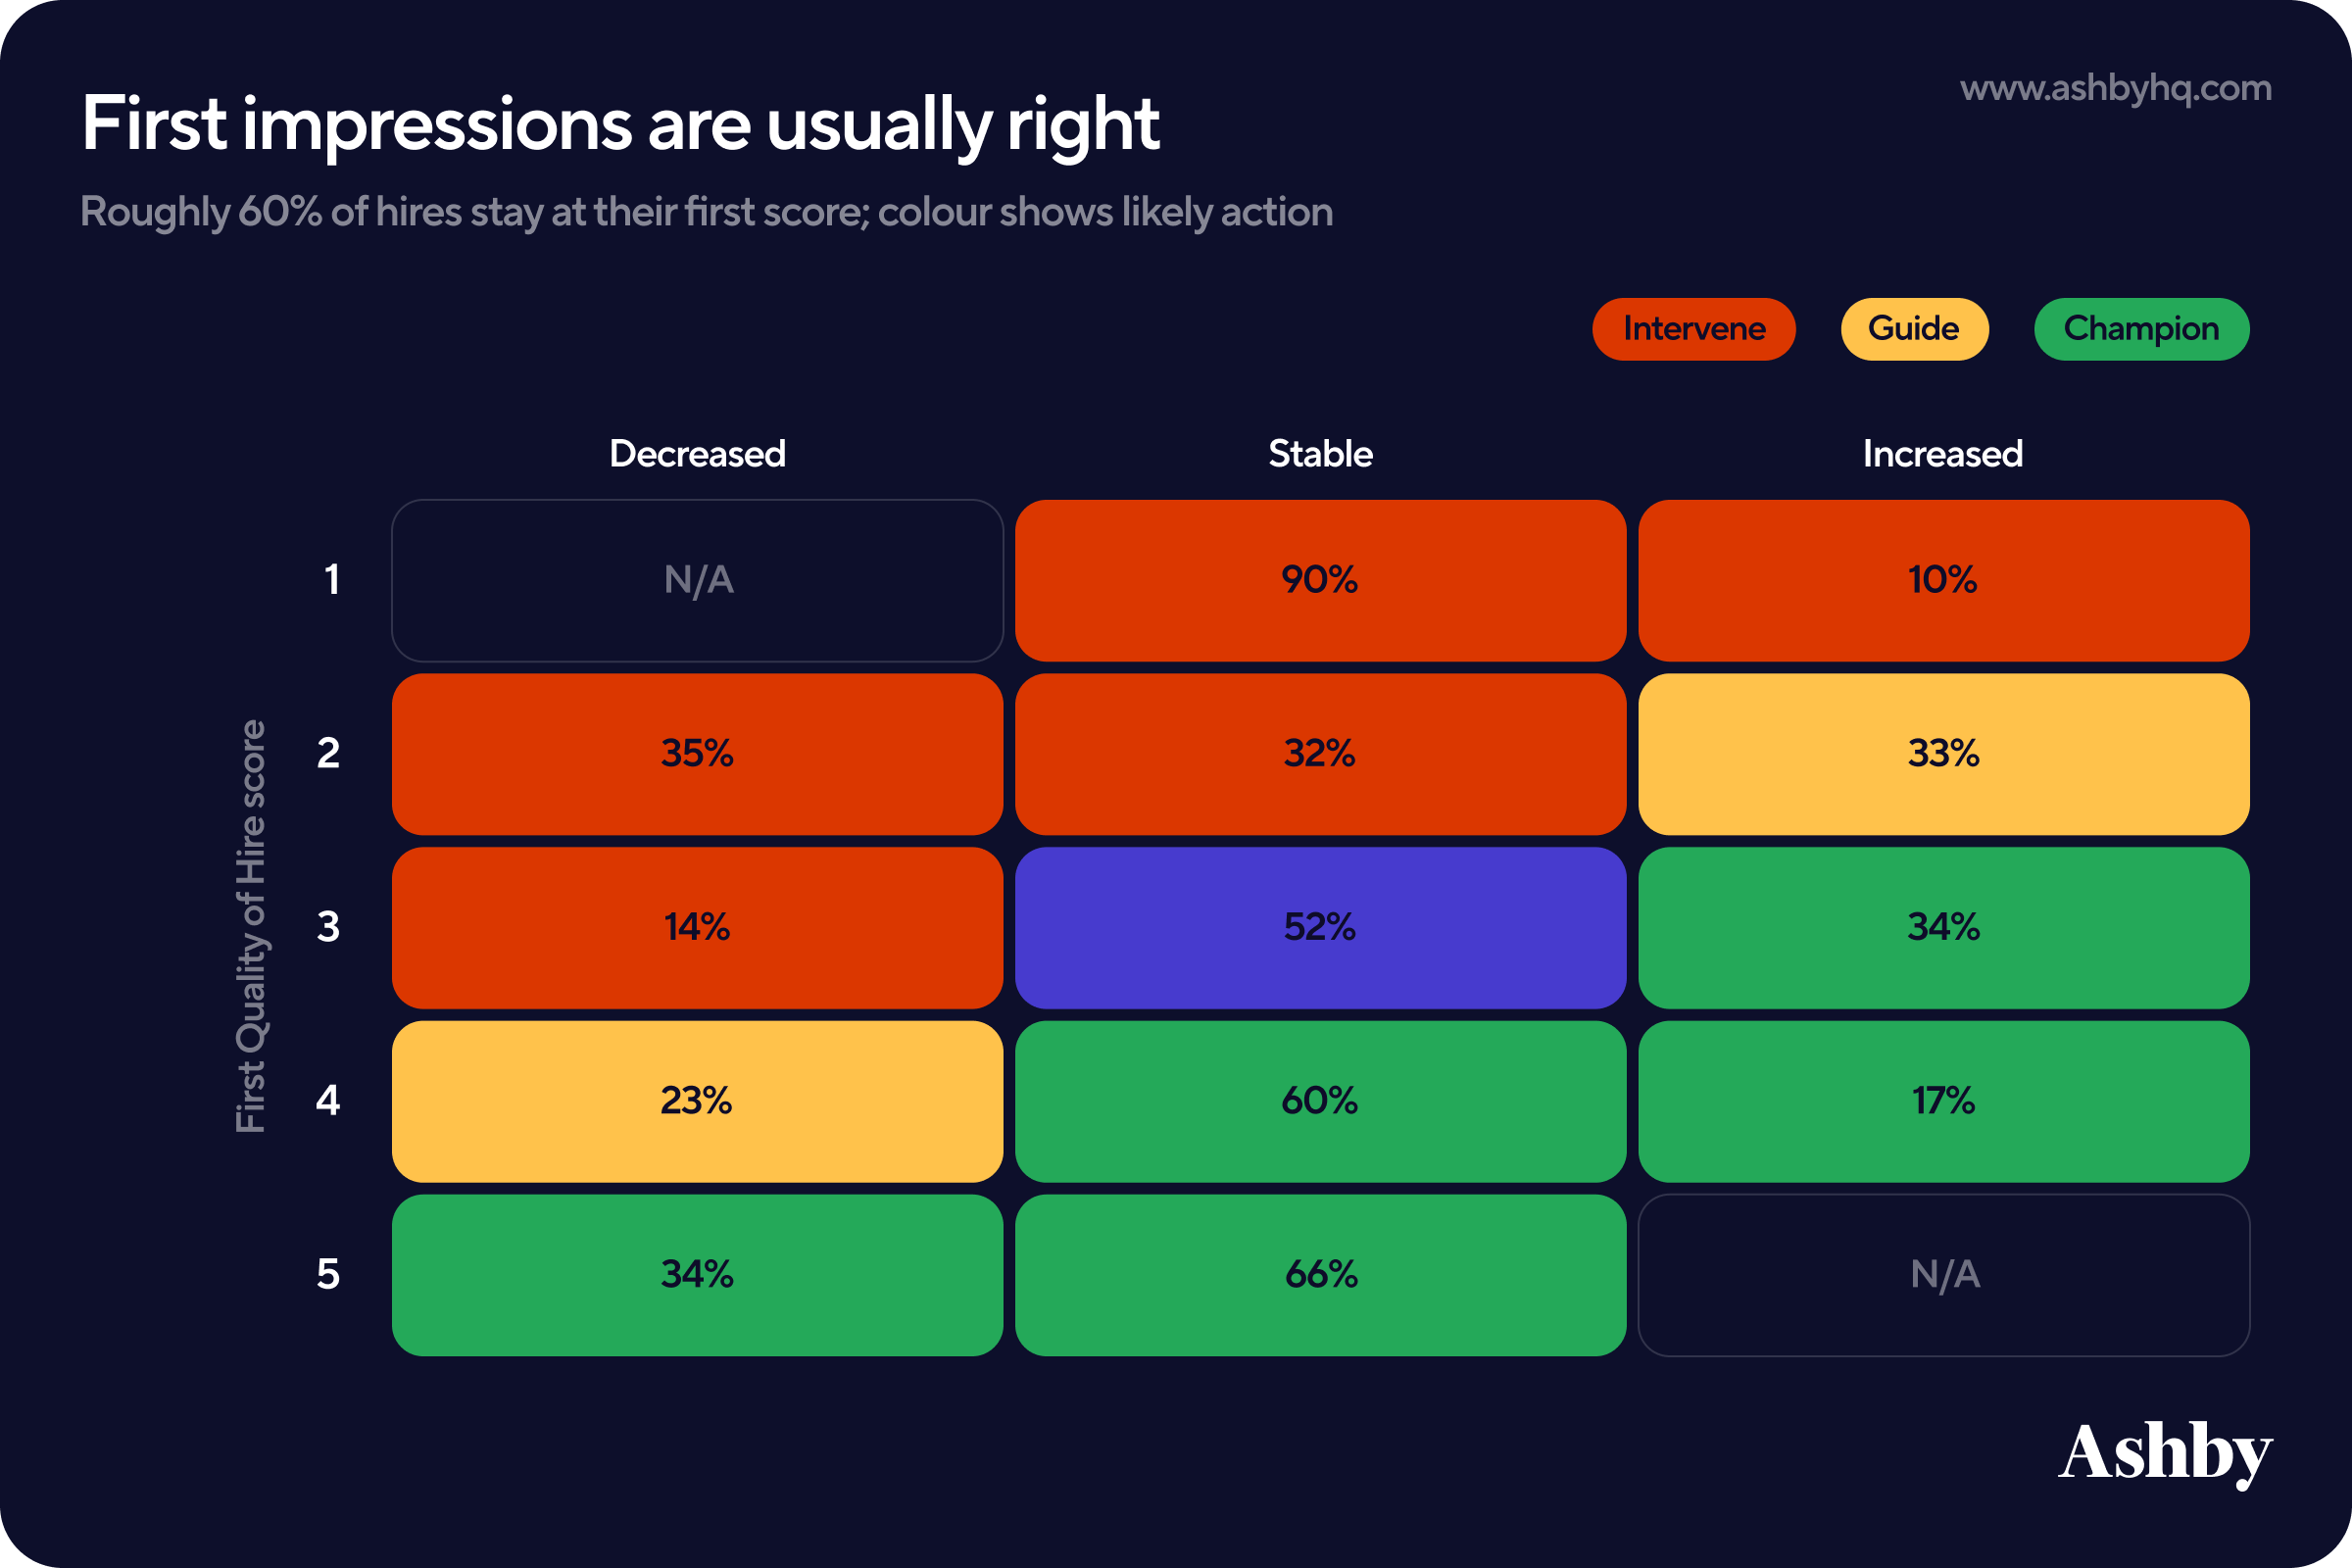
- If a new hire receives a 1 as their first score, it's rare that they improve: 90% stay at a 1, and only 10% move up.
- For hires who start at a 2 (does not meet expectations), the picture is more mixed. Two-thirds of the time they stay at a 2 or drop further, and the other third they improve to meet expectations.
- Once a hire's first score is a 3 or higher, the pattern shifts: Just 14% of hires who start at a 3 later drop below "meets expectations," and it's rarer for a hire who starts at a 4 or 5 to fall even that far.
- Across every score, roughly 60% of hires land in the same place they started.
That last point suggests a hiring manager's read on a new hire at 30 days often looks a lot like their read on them much later in their tenure.
In layman's terms, this means two things:
- Most hires meet or exceed expectations from the start, and the ones who do rarely slide backward.
- The first few months of a new hire's tenure carry real signal, which means the work of the Talent team doesn't always end at the offer stage.
As hiring outcomes become inseparable from performance outcomes, the line between Talent Acquisition and People Ops keeps getting thinner. Tim has seen this pattern closely enough at Sony to build his onboarding process around it.
"We can tell with 88% certainty if someone is going to be successful or not in the first month. For us that's massive. And then what we saw after that was the second month (weeks four to eight) is where things could go really south really quickly. If people started dropping off, they dropped off hard. So that became our intervention window. Once they've got through that first month, you measure how well they're doing. If they're successful, they will continue to be successful. If they're not doing so well, that's where we kind of step in. And it's not a 'you need to do better' conversation. It's understanding how they could do things better and what successful people were doing to get that mirrored in them."
— Tim Chattaway, Director of Talent Acquisition, Sony Sports Technology
Tim's experience points to a practical takeaway for teams sending Quality of Hire surveys at three intervals: The window right after the second score is where intervention plans matter most, since that's when hiring teams have the best chance to change the outcome for hires who are still finding their footing.
Adoption of Quality of Hire is Growing
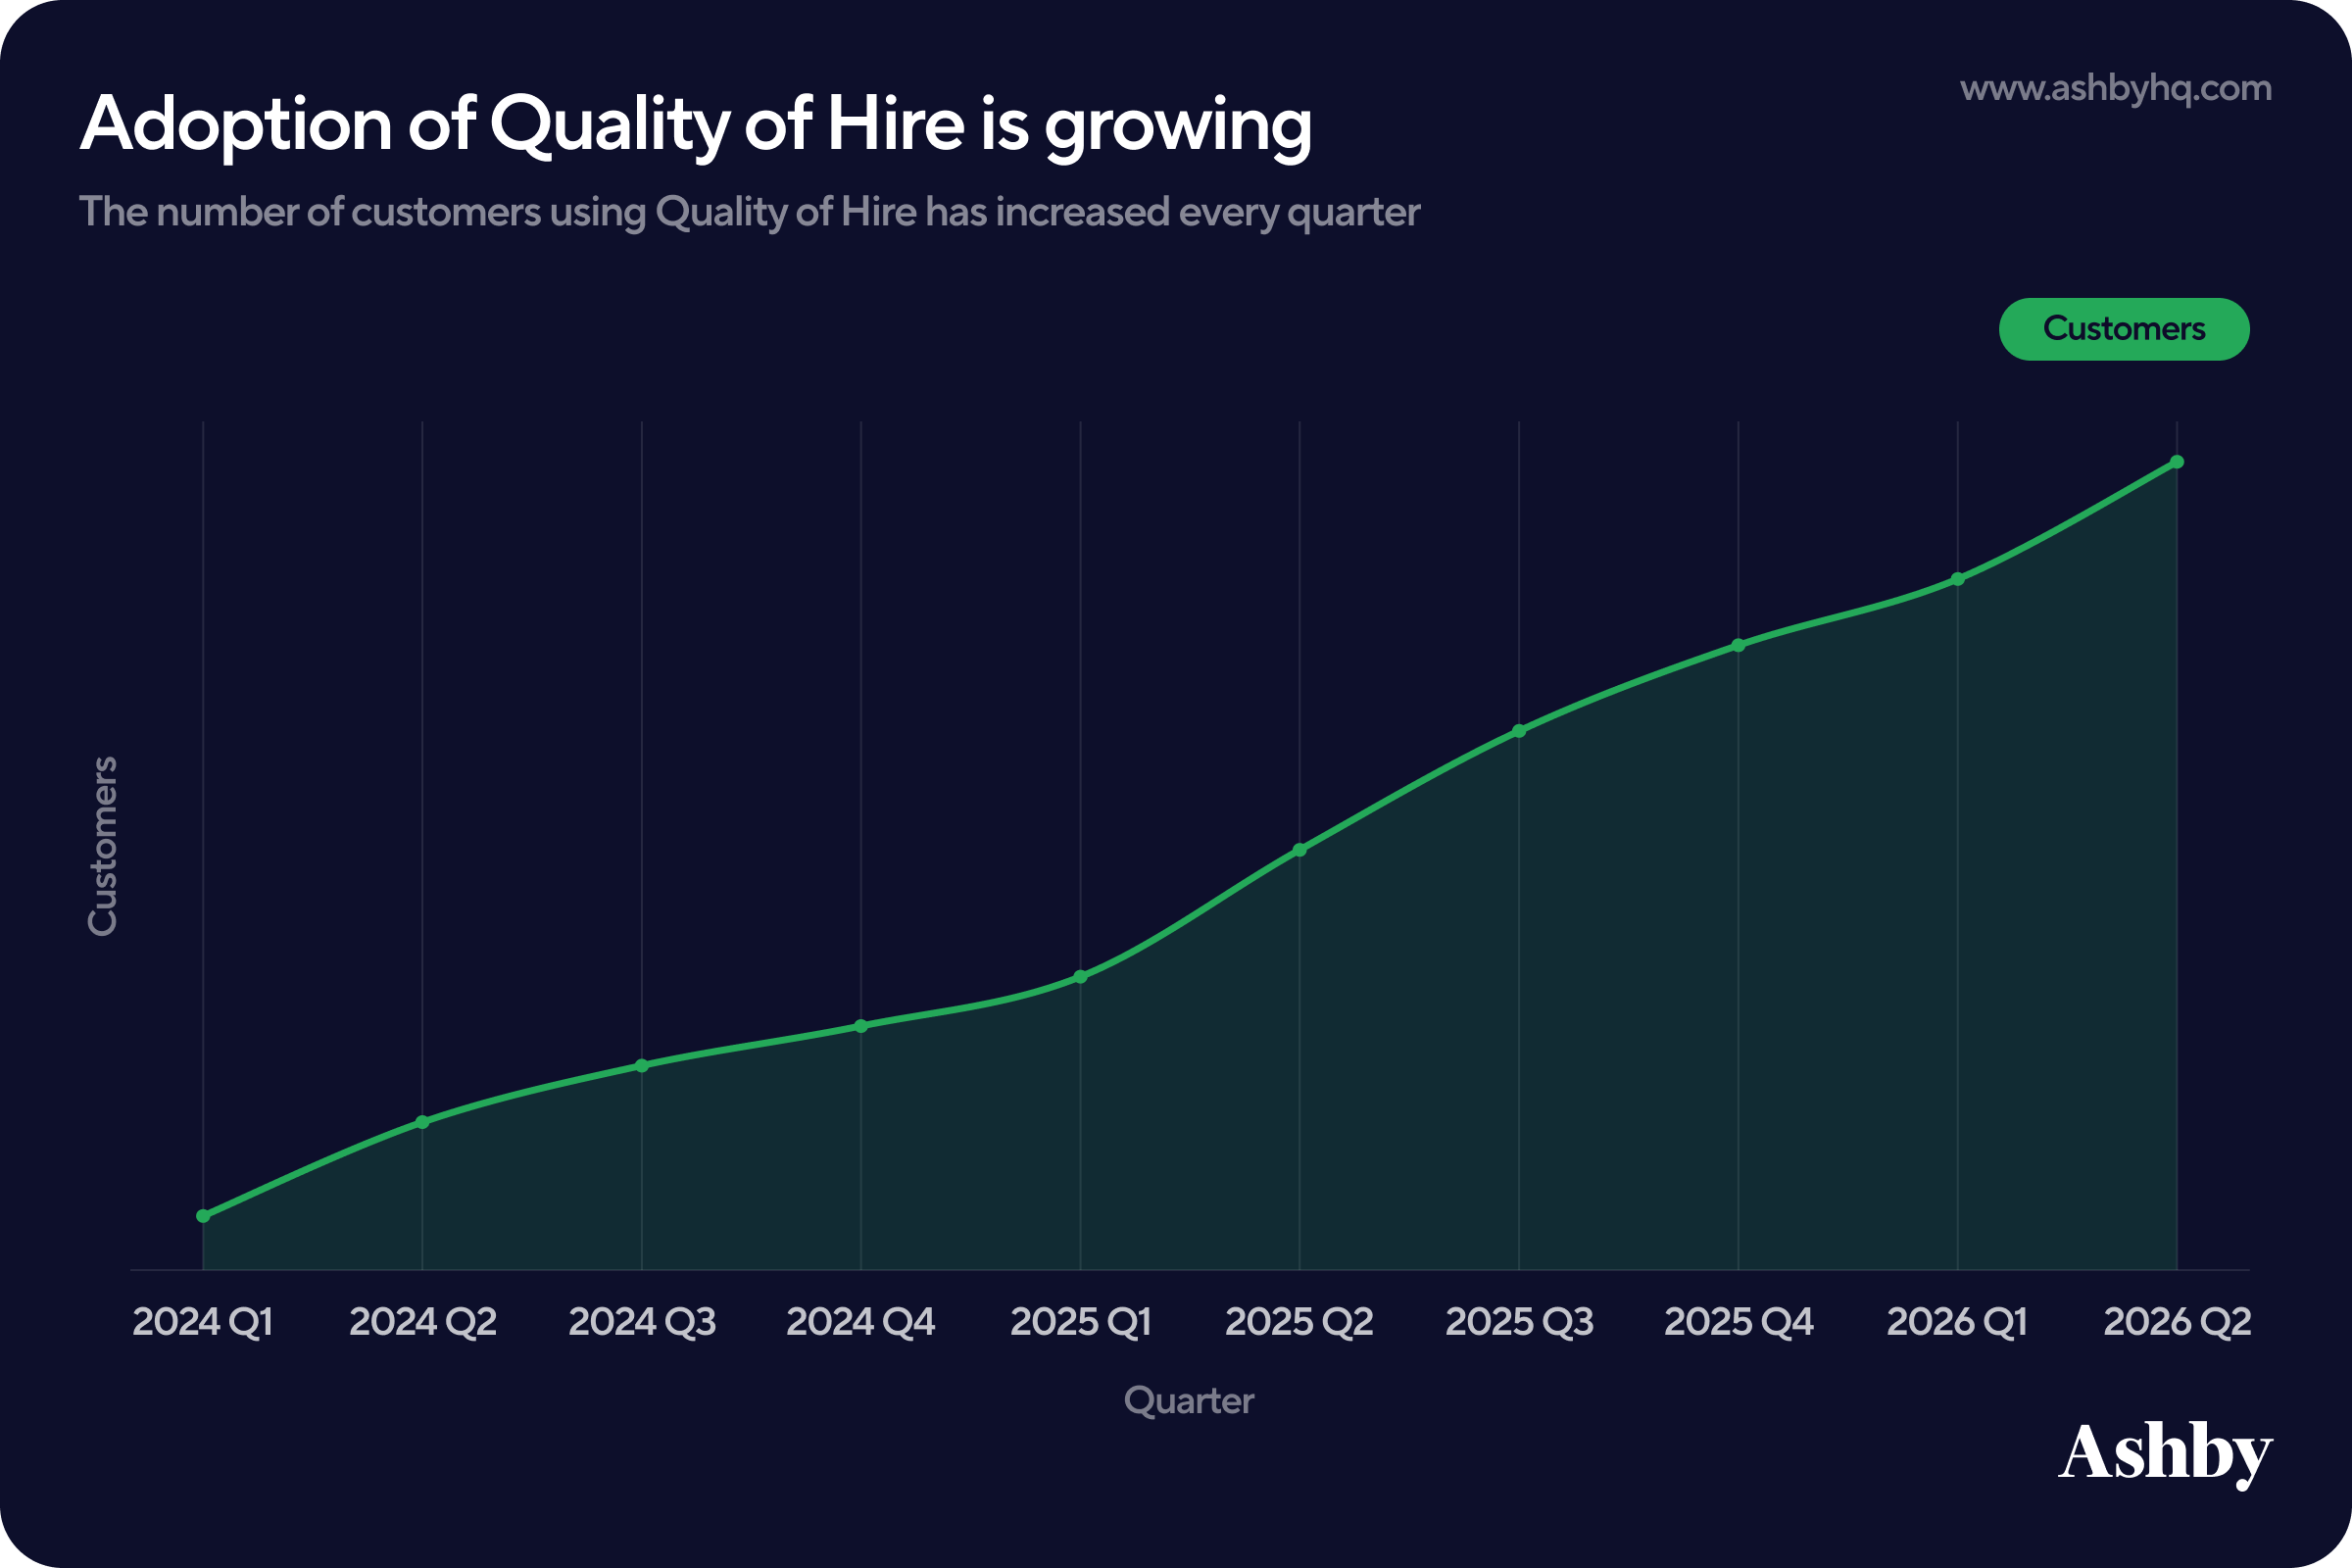
Quality of Hire has moved well past the experimental stage. The volume of Quality of Hire surveys sent has grown meaningfully since we launched the feature in 2024, and that growth has only accelerated over the past year. Similarly, the number of customers using Quality of Hire has grown quickly. As the tooling and process around talent technology matures, Quality of Hire becomes another contributor in Talent Acquisition's growth as a strategic function. In Q2 2026, 25% of our Enterprise customers used Quality of Hire.
Enterprise organizations like Flock and Sony Sports Technology are good examples of this shift. Laura and Tim's teams started with a simple survey and have since built out multi-interval programs that inform everything from interview calibration to workforce planning.
"Rather than spending a lot of time trying to figure out the exact science, we just wanted to get something off the ground. At Flock, we have a bias towards action, and that allows us to be comfortable with producing a V1. Ashby made our V1 so easy. We went back to the business and said: 'Hey we turned this survey on. It's automatic, easy to fill out, and we want you to answer a simple question. We're going to take your answer and apply that to how we evaluate our interview processes.' This data is extremely actionable and that got hiring managers excited. It didn't feel like you submitted a form and it went into a black hole."
— Laura Barnes, Vice President of Recruiting at Flock
Ashby's Quality of Hire surveys are built to remove survey submission friction and have performance insights earlier in a hire's tenure. Our surveys run on a configurable, automated cadence (commonly 30/60/90 days), arrive directly over email or Slack, and come with smart-default questions so teams don't have to design from scratch to get started. The result is less manual chasing for the Talent team and a faster, more consistent flow of data to act on. See how Quality of Hire works in Ashby today.
Quality of Hire is proving what it set out to prove. The moment of hire isn't the finish line, but the starting point for understanding whether a hiring process actually works. Across two years of data, a few things stand out clearly:
- Most hires meet or exceed expectations, and the first score a new hire receives is one of the strongest signals of where that hire is headed.
- Strong, decisive interview feedback, even when it's mixed, tends to outperform safe consensus across the panel.
- Sourcing channels perform fairly consistently overall, though referrals continue to carry a modest edge.
Together, these findings point to the same conclusion Laura and Tim each arrived at independently: Quality of Hire works best as an ongoing practice built into how a team hires, onboards, and improves. As more companies adopt it, we expect that discipline to become table stakes for any team building talent dense organizations.
Other Reports

The State of Startup Hiring | 2026 Talent Trends Reports
Data from 1,200+ venture-backed startups on AI adoption, remote hiring, application volume, time to hire, and offer acceptance rates.

Offer Acceptance Rates | Talent Trends Report
We analyzed Offer Acceptance Rate (‘OAR’) patterns over a three year period to share valuable insights and benchmarks for talent teams.
Subscribe for more talent trends and insights
We will be regularly releasing new reports around trends and insights we're seeing in our data and you will be the first to know.