Recruiting Operations Benchmarks | 2026 Talent Trends Report

11 minute read
Topics
Table Of Contents
Hiring is often measured through a handful of familiar metrics such as Time to Fill, Time to Hire, or passthrough rates. However, these metrics are outputs of a much larger system. In this report, we take a Recruiting Operations perspective on hiring performance and break down different parts of the system — from how long it takes to fill a role, to how candidates move through interviews, to how source strategy shapes outcomes.
This report analyzes over 54M applications and 93K jobs from January 2021 through March 2026.
Report Highlights:
Across the data, a few themes emerge:
- Hiring becomes more predictable as systems mature, with Time to First Fill stabilizing as organizations scale
- Time to Hire is shaped by many small delays across the process versus a single bottleneck
- Automated scheduling methods are 26% faster than manual scheduling, highlighting one of the largest areas RecOps teams can drive efficiency with tooling
- Application source meaningfully impacts funnel performance, with referred candidates seeing notably higher passthrough rates at nearly every stage
- Process discipline directly impacts both data quality and candidate experience, particularly in areas like feedback and archiving
Overall, these findings point to a simple idea: hiring performance is driven by how well the system operates as a whole. Let’s dig in.
I. Time to First Fill
We all know the commonality of TTF in hiring metrics. In our Talent Trends Reports, we specifically measure Time to First Fill. In other words, the time from when a job was opened to when the first hire was made.
While talent leaders and recruiters look to this metric for speed and efficiency, Time to First Fill can be seen as a measure of system predictability. Across our data, we consistently see that Time to First Fill is shaped by two primary factors:
- Organizational Scale
- Role Complexity
Organizational Scale
One of the clearest patterns in the data is how much timing varies from early-stage startups to enterprise-level organizations. Smaller organizations tend to show a wide distribution, showing what we intuitively know: Startups can move very quickly, outperforming larger organizations, but are also at risk of having hiring efforts drag out for much longer. As organizations grow, this variability narrows and timelines begin to standardize.
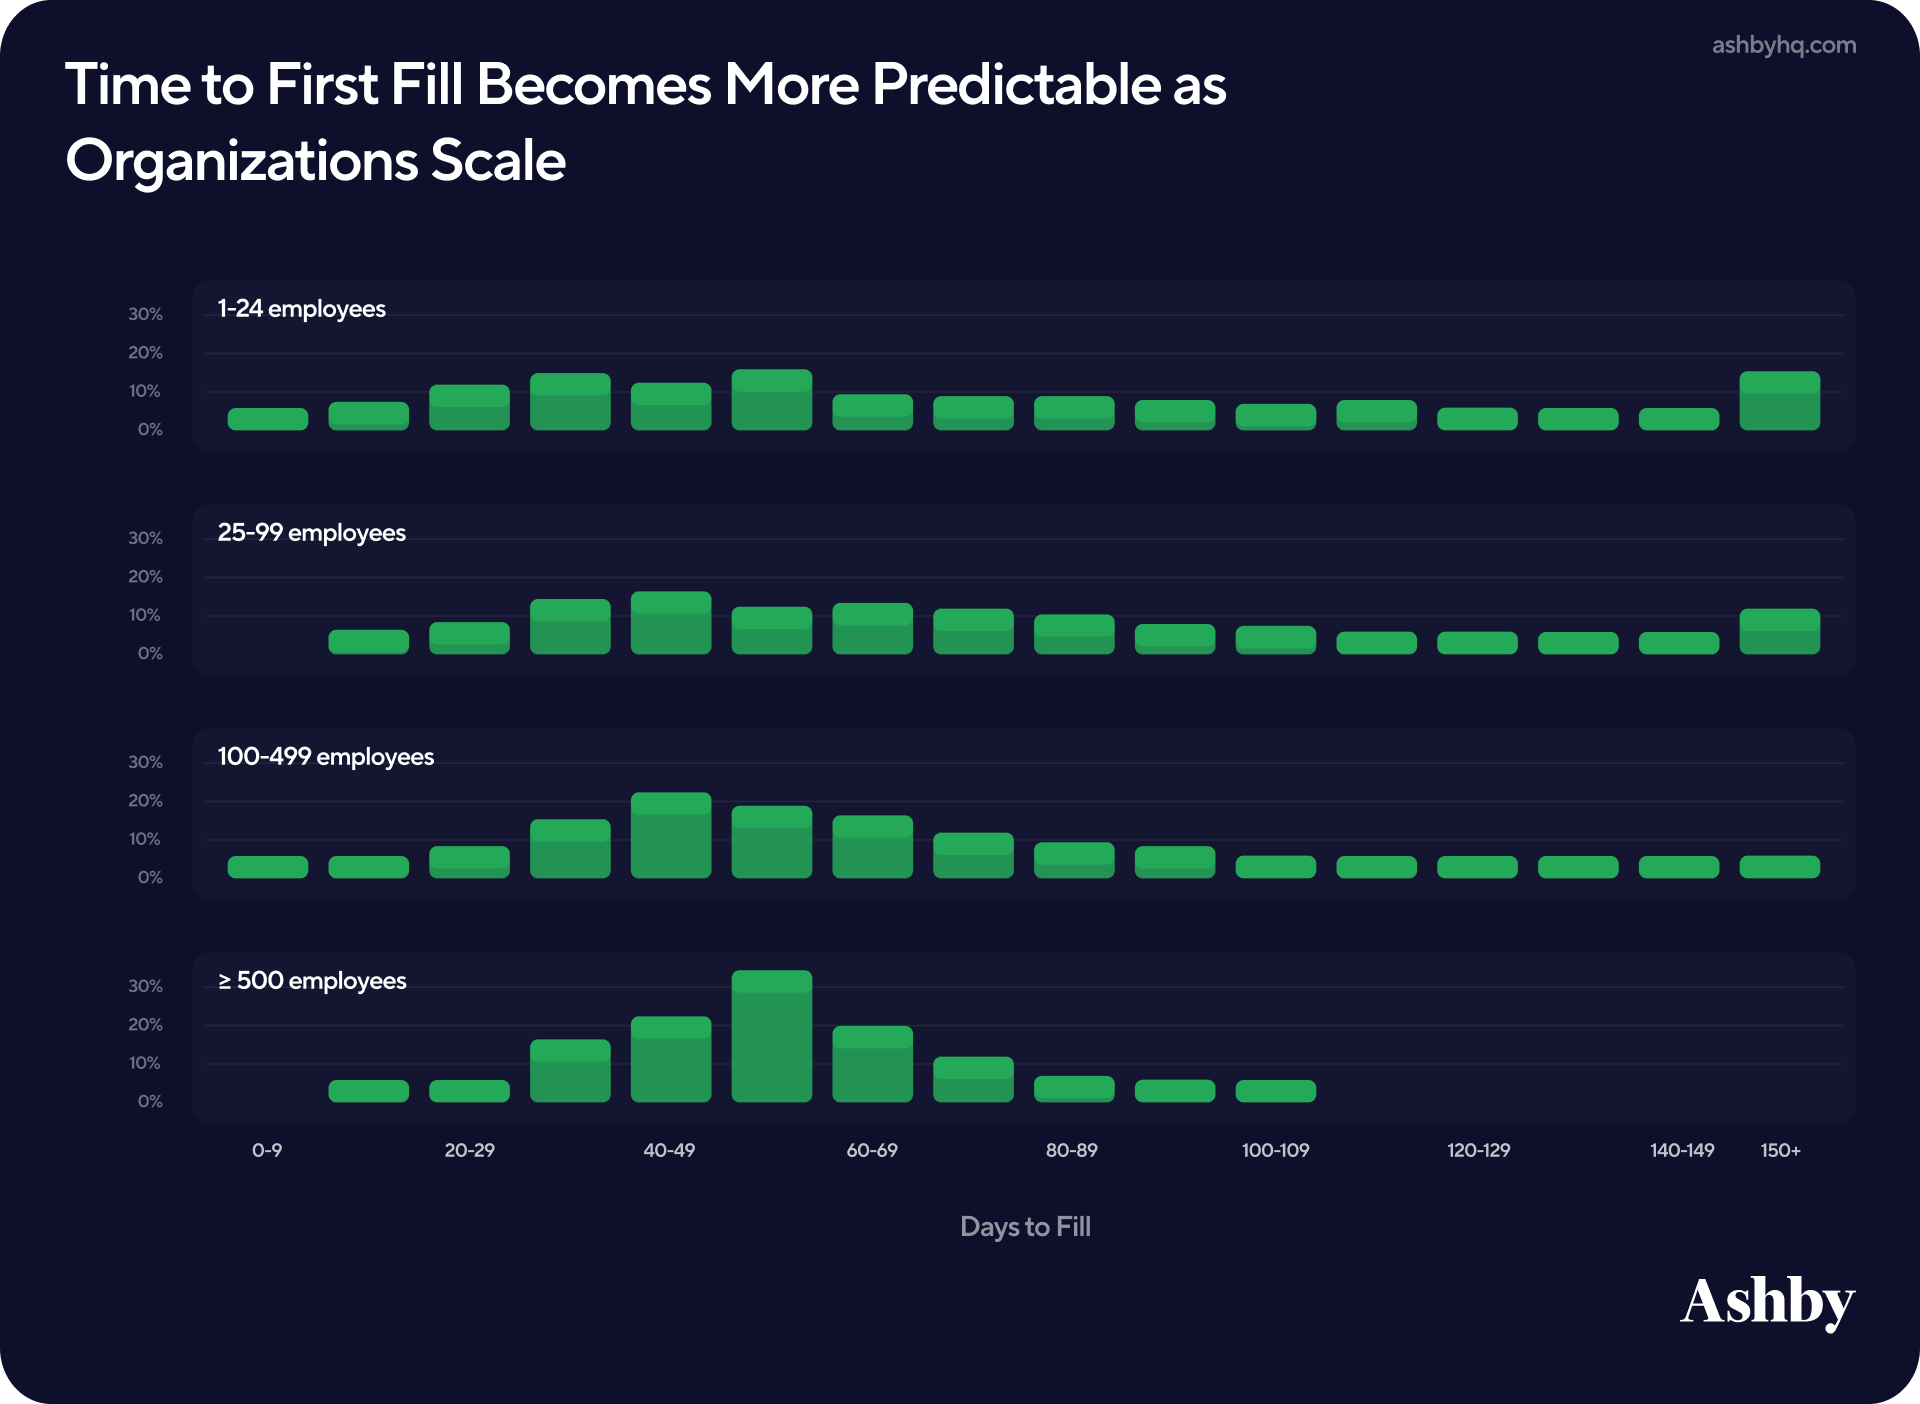
This suggests that as hiring systems mature, the first improvement is not necessarily speed, but consistency. In talent teams we work with at Ashby, we often see the first RecOps hires made between 200 to 500 employees. At that stage, teams are often dealing with misaligned expectations, inconsistent processes, and limited visibility into hiring performance.
This data indicates that signals of that need may be appearing earlier. Even around ~100 employees, Time to First Fill begins to stabilize, creating an opportunity for teams to move from reactive hiring to more structured planning.
For talent leaders considering their first RecOps hire, this could be seen as the inflection point: When Time to Fill becomes consistent enough to support accurate headcount planning, clearer stakeholder expectations, and better alignment with business timelines — but before process debt compounds.
Role Complexity
Perhaps unsurprisingly, senior-level roles take more Time to First Fill. In the data we see that:
- Senior roles take 37% longer to fill than junior level positions
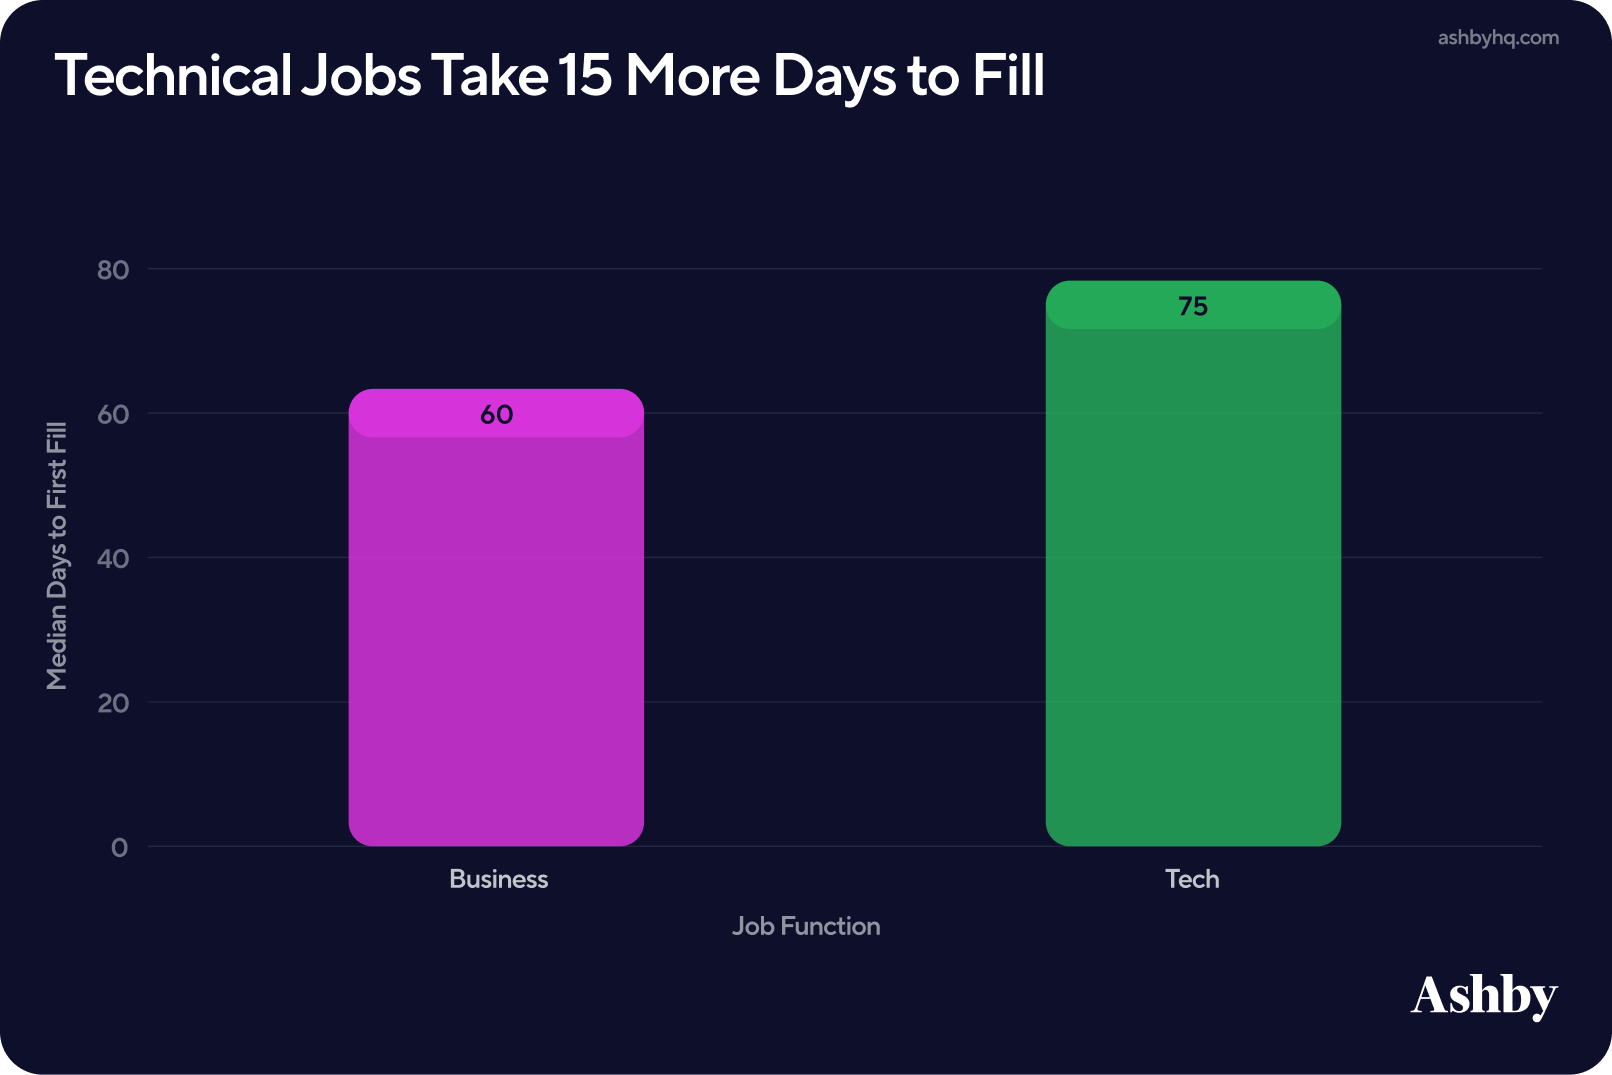
- Technical roles require more time to fill (~15 days) than business roles
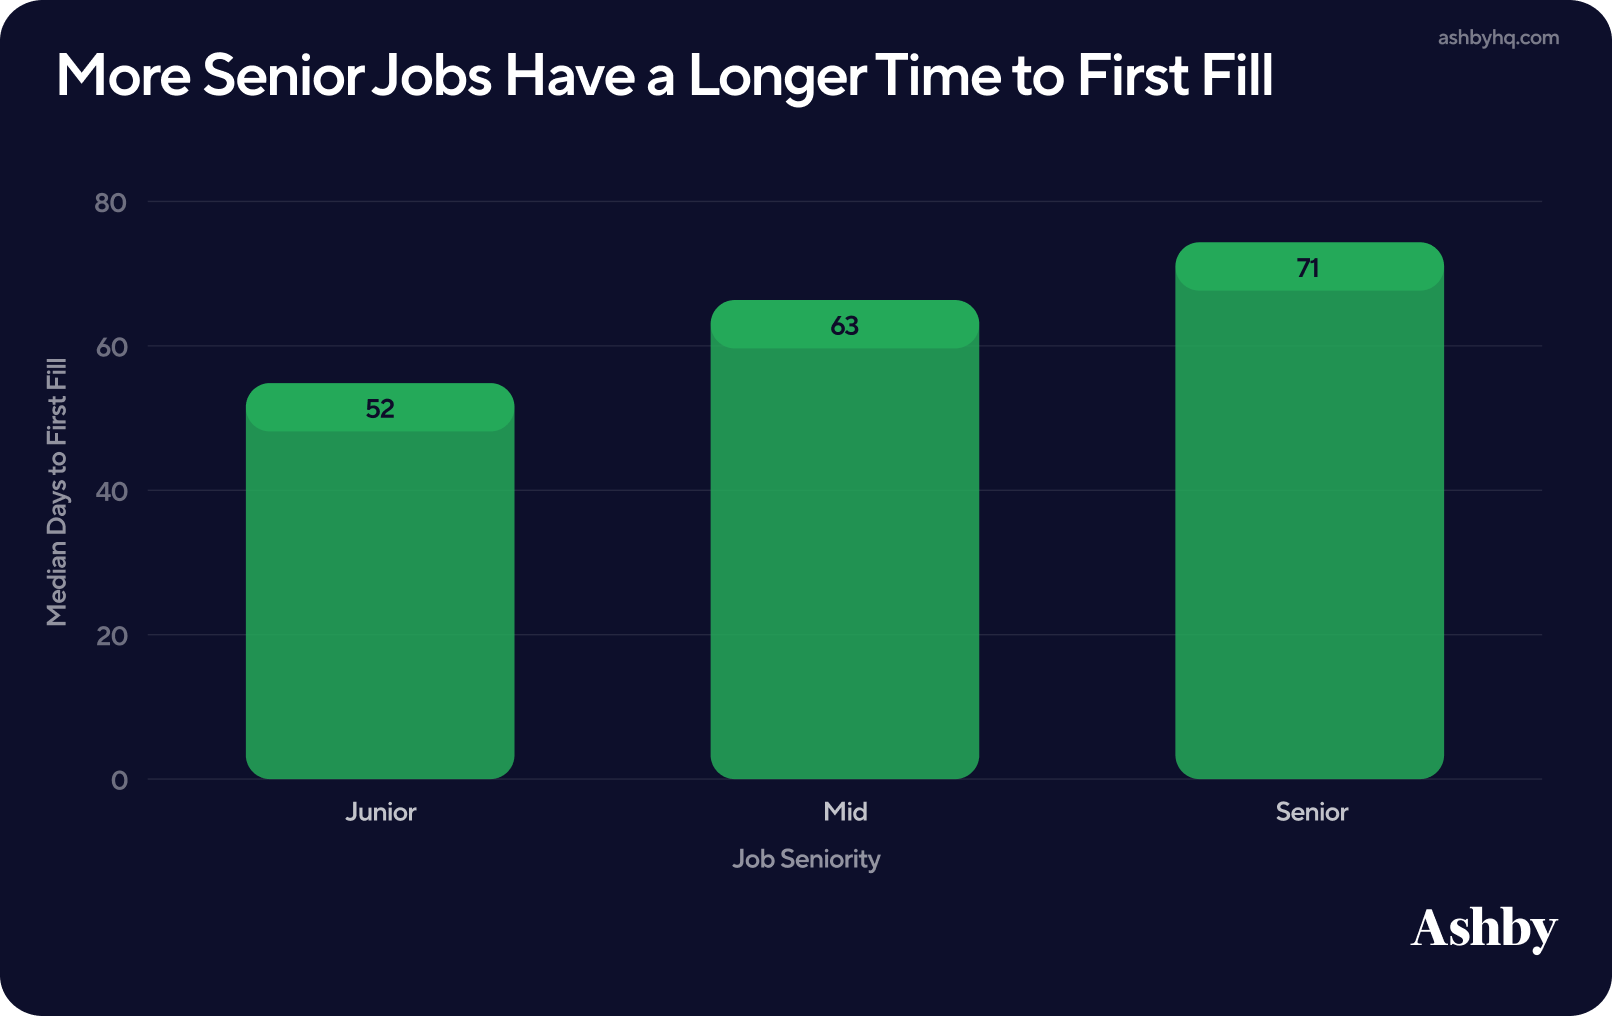
Our past reporting, has consistently tracked that technical jobs take longer to fill. For RecOps, this reinforces the importance of benchmarking within role type as a single TTF target across all functions can create misleading signals, making some teams appear slower when they are operating within expected ranges.
These two findings taken together reflect differences in talent supply, evaluation complexity, and interview design.
Next in this report, we’ll see how this comes into context with metrics such as applications per hire. Teaser: Technical roles tend to receive more applications per hire, involve more interview stages, and require deeper evaluation — all of which extend hiring timelines.
II. Where Time is Spent in Hiring
While Time to First Fill reflects overall system predictability, Time to Hire provides a closer look at how efficiently candidates move through that system. For Recruiting Operations teams, this is where the metric becomes more actionable.
Time to Hire is effectively the sum of many steps across the hiring process, with RecOps owning many of the inputs that go into it. An easy way to distinguish is strategy versus process:
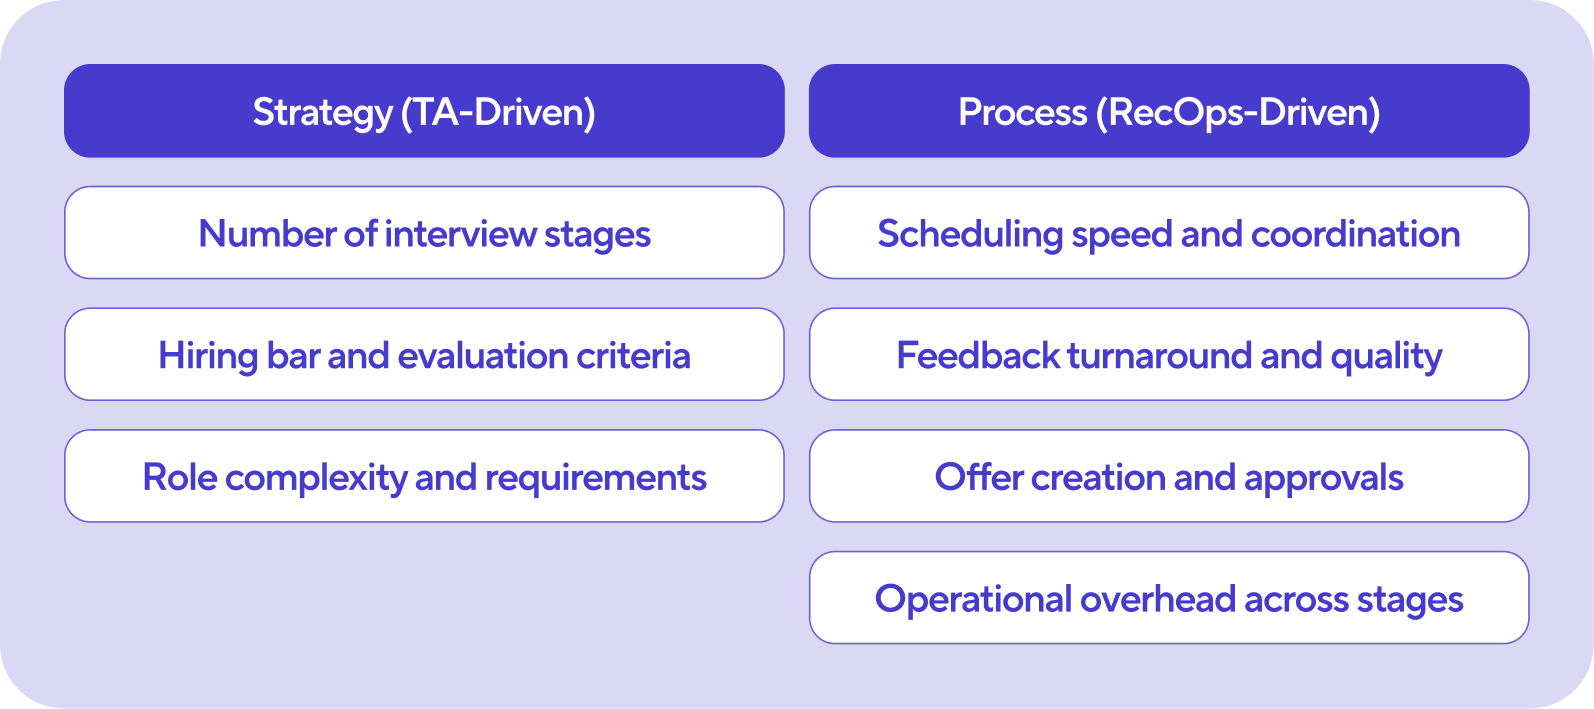
With the process lens in mind, this section focuses on where time is spent and where delays are most likely to occur. Across organizations, we consistently see that Time to Hire is not driven by a single bottleneck, but by a combination of smaller delays across each stage of the process. Companies that have a generally good Time to Hire may still struggle with one or two of these bottlenecks. These include:
- Application Review
- Scheduling
- Feedback and Decision-making
- Offer Approvals
This chart splits companies by the top and bottom quartiles by their Time to Hire, and finds the difference in their average time per process. We’ll define each metric in more detail below.
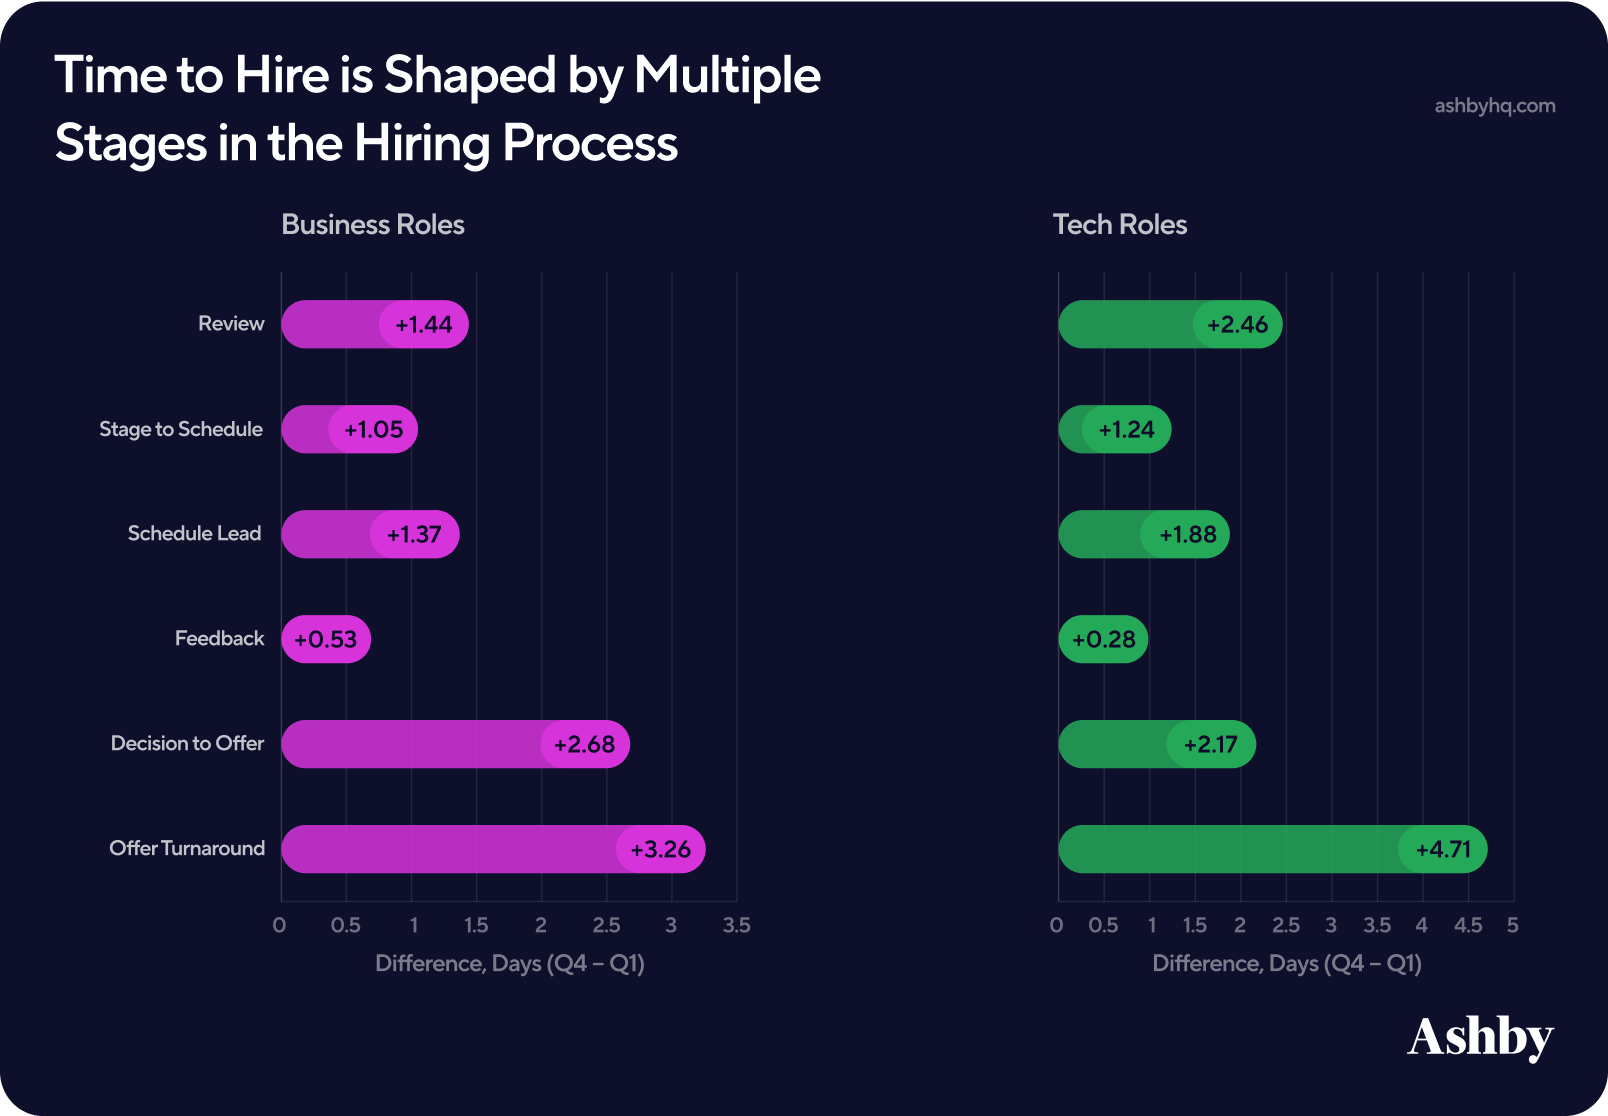
Let’s look at each potential bottleneck highlighted here in more detail, alongside Ashby solutions RecOps practitioners can consider to solve for each.
1. Application Review
Potential Bottleneck:
The review stage is often the first point of delay, particularly for roles with high application volume. Technical roles tend to receive more applications per hire and require more evaluation per candidate. As a result, hired candidates in these roles often spend more time in review compared to business roles. Further, we see that the difference in review time between high performing companies and companies with a slower time to hire is greater for tech roles than business roles.
For RecOps, this highlights the importance of supporting efficient and consistent review workflows — especially in high-volume pipelines where small delays can quickly compound.
Technology Solution:
More teams using Ashby are turning to AI-assisted application review to support this process. By defining clear criteria upfront and using AI to evaluate applications against those criteria, teams can quickly identify candidates who meet key requirements while maintaining a human-centered final decision.
This approach reduces time spent triaging large volumes of applications, improves consistency across reviewers, and allows teams to focus more time on high-signal candidates — all of which help reduce delays at the very start of the hiring process.
2. Scheduling
Potential Bottleneck:
Scheduling introduces two distinct components of delay: how quickly interviews are scheduled and how far out those interviews are booked. We measure this as:
- Stage to Schedule: the time from entering a stage to when a schedule is sent
- Schedule Lead Time: the time between a schedule being sent and the interview taking place
Across the data, schedule lead time tends to be the larger bottleneck. Even when interviews are scheduled quickly, limited interviewer availability and calendar constraints can push interviews several days out. This makes scheduling one of the most important (and most controllable) levers for improving Time to Hire, particularly in complex or multi-interviewer processes.
Technology Solution
As scheduling complexity increases with multiple interviewers, panels, and competing calendars, manual coordination quickly becomes a source of delay. Advanced Scheduling workflows help address this by automatically generating optimal interview times, accounting for interviewer availability, and adapting when conflicts arise to reduce both scheduling time and coordination overhead. Further, since lead time can be driven by limited interviewer availability, many teams also focus on expanding and structuring interviewer pools. By increasing the number of qualified interviewers through pools and training, teams create more scheduling flexibility and reduce delays caused by constrained availability.
3. Feedback and Decision-Making
Potential Bottleneck:
While feedback submission itself takes less time than other steps considered here, the time between the final interview and a hiring decision is one of the most significant sources of delay in the hiring process. These two processes are directly intertwined, and improving on one can help the other.
This gap reflects alignment, deliberation, and confidence in the decision being made. In many cases, delays occur not because feedback is missing, but because it is incomplete, inconsistent, or difficult to synthesize across interviewers.
Technology Solution:
RecOps teams benefit when interviewers use tools like AI Notetaker to improve both the speed and quality of feedback. By automatically capturing interview notes, generating summaries, and providing access to transcripts, these tools help ensure that feedback is more complete, consistent, and easier to reference.
In our prior analysis on AI notetaking, we found that teams using these workflows see higher feedback submission rates:
- Within 5 hours of an interview: Scorecard submission rates are ~9% higher when AI Notetaker is used.
- Within 24 hours: ~6% more scorecards are submitted with AI Notetaker (70% vs. 66%).
4. Offer Approvals
Potential Bottleneck:
The final step in the hiring process is the transition from decision to offer, which we measure as offer turnaround — the time between a candidate entering the offer stage and an offer being created. At many organizations, this step involves multiple stakeholders, approvals (finance, people, leadership), and manual steps that can slow down what should be a straightforward process.
This is one of the clearest opportunities for RecOps to reduce friction. Once a decision has been made, delays at this stage simply extend the time it takes for a candidate to move forward and be in-seat and providing value to the business.
Technology Solution:
To streamline this step, many teams are standardizing their offer workflows through templates and automated approval processes. Offer templates with built-in controls help ensure consistency across roles while reducing the need for manual edits and back-and-forth between stakeholders. Examples here include centralizing key fields, enforcing guardrails, and automating approvals where possible.
III. Interviews
While Time to Hire highlights where delays occur, the interview process reveals why those delays happen (more stakeholders, coordination, and variability across departments). For RecOps, this is where process design begins to intersect with hiring strategy, and where structural decisions have a direct impact on hiring efficiency.
In this section, we look at how interview complexity shows up across scheduling, structure, and signal.
1. Scheduling Complexity
Earlier we looked at the speed of scheduling; here we focus on the structure driving that complexity. To start, the method used to schedule interviews has a meaningful impact on how quickly interviews are confirmed.
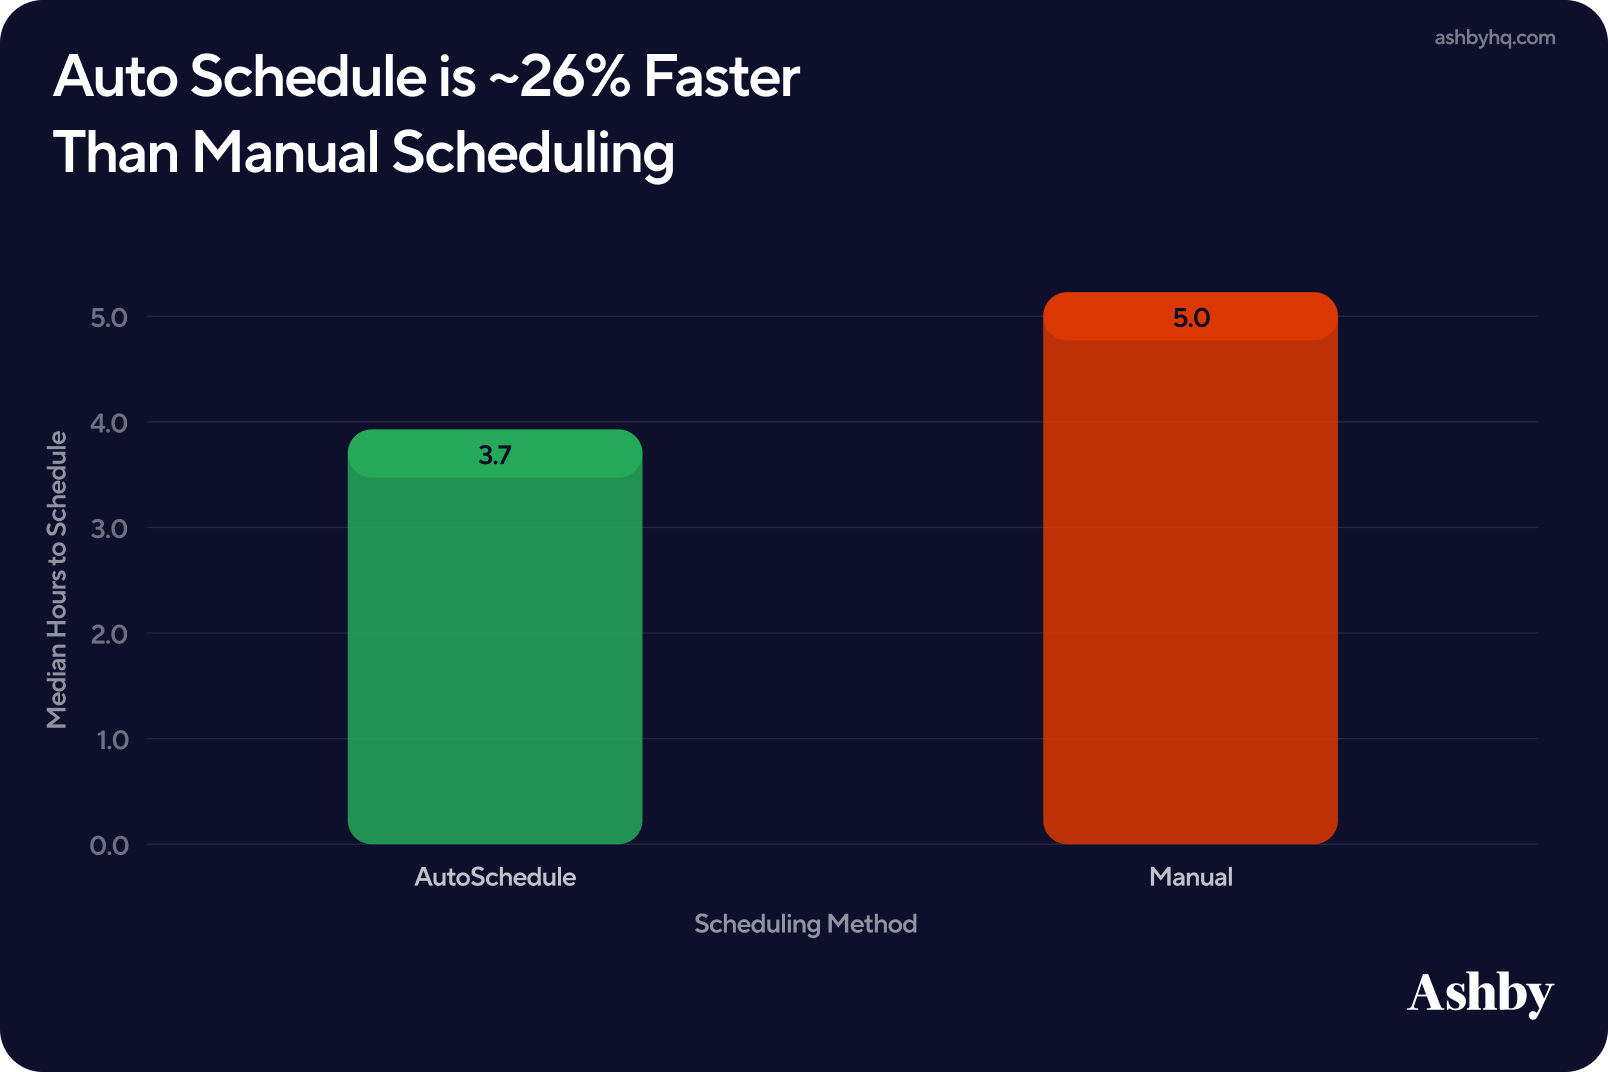
Teams using Ashby’s Auto Schedule confirm interviews 26% faster than manual scheduling.
- Automated scheduling methods take a median of 3.7 hours, compared to 5 hours for manual scheduling.
- That 1.3 hours saved compounds across multiple interview stages, particularly in roles with more complex interview loops.
All Ashby plans come with a powerful core scheduling feature. For teams handling high-volume or multi-panel scheduling, the Advanced Scheduling add-on amplifies those efforts by automating complex interview loops, managing interview availability and replacing declined interviewers to keep scheduling on track.
2. Interview Structure
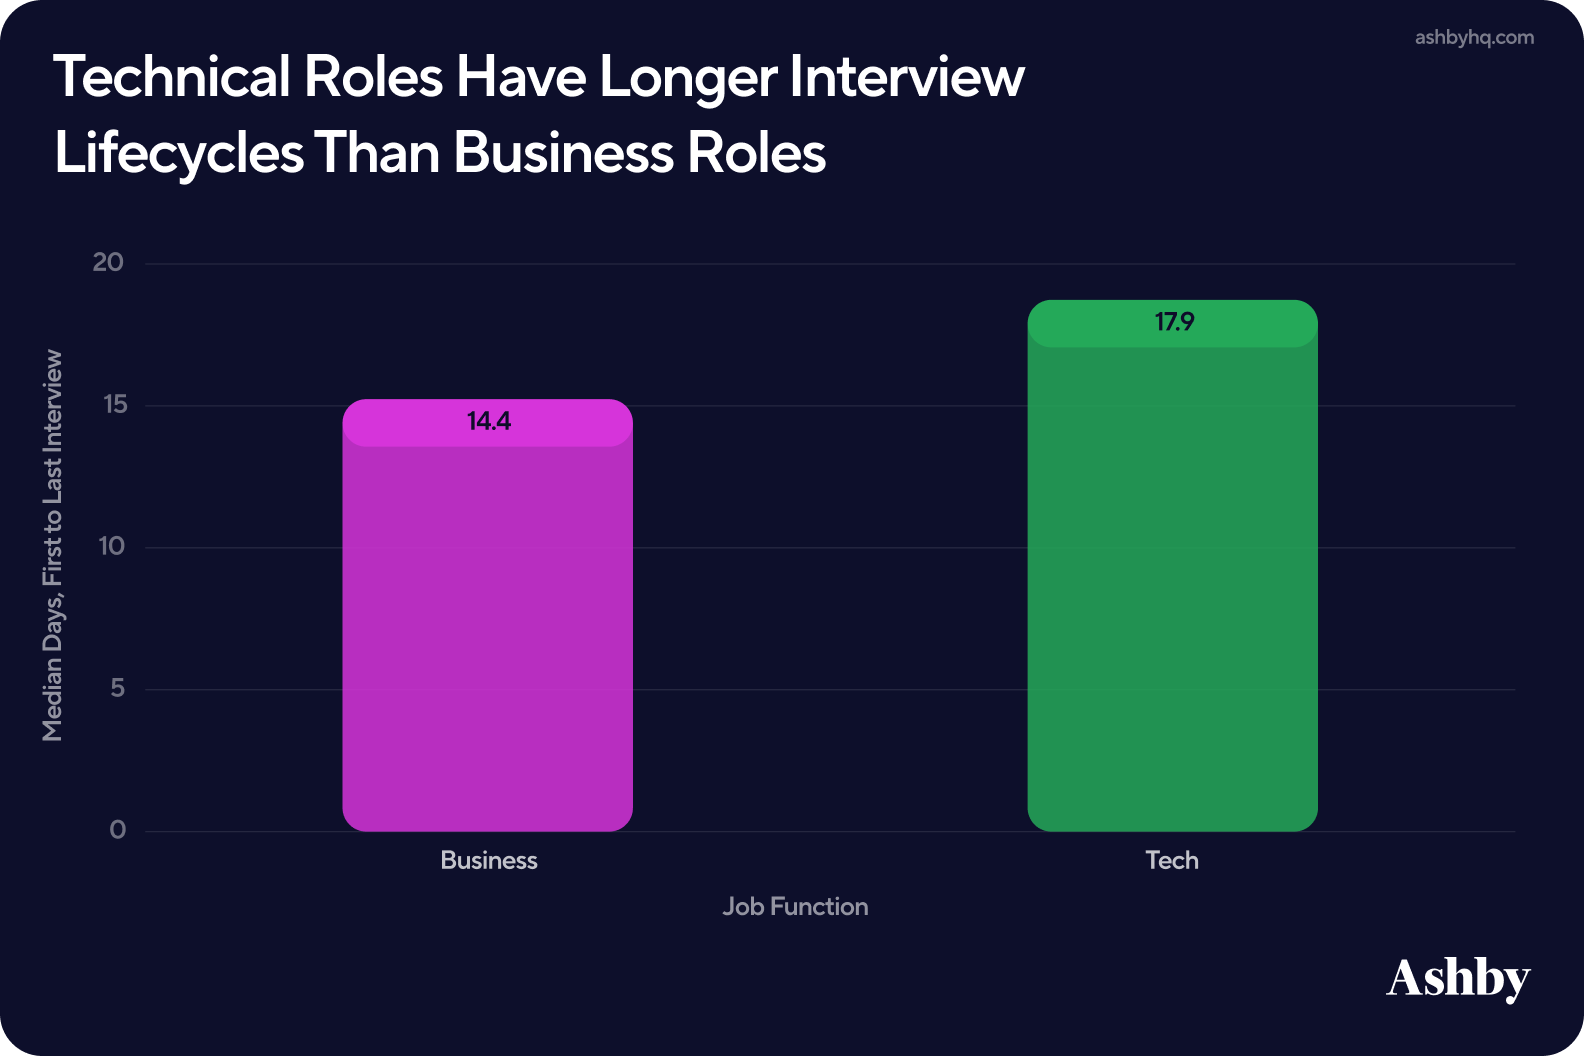
Interview structure varies meaningfully by job function, with hired technical candidates requiring more time (~18 days) to complete the full interview loop from screen to final interview. Hired business candidates take roughly 14 days from first to last interview. This added time aligns with what we saw across earlier metrics, where technical candidates typically go through more interviews and spend more time in evaluation.
For RecOps, this is a useful input for setting realistic timelines and stakeholder expectations by function. A single interview lifecycle benchmark applied across both business and technical roles will consistently make technical hiring look slower than it actually is.
3. Signal and Alignment
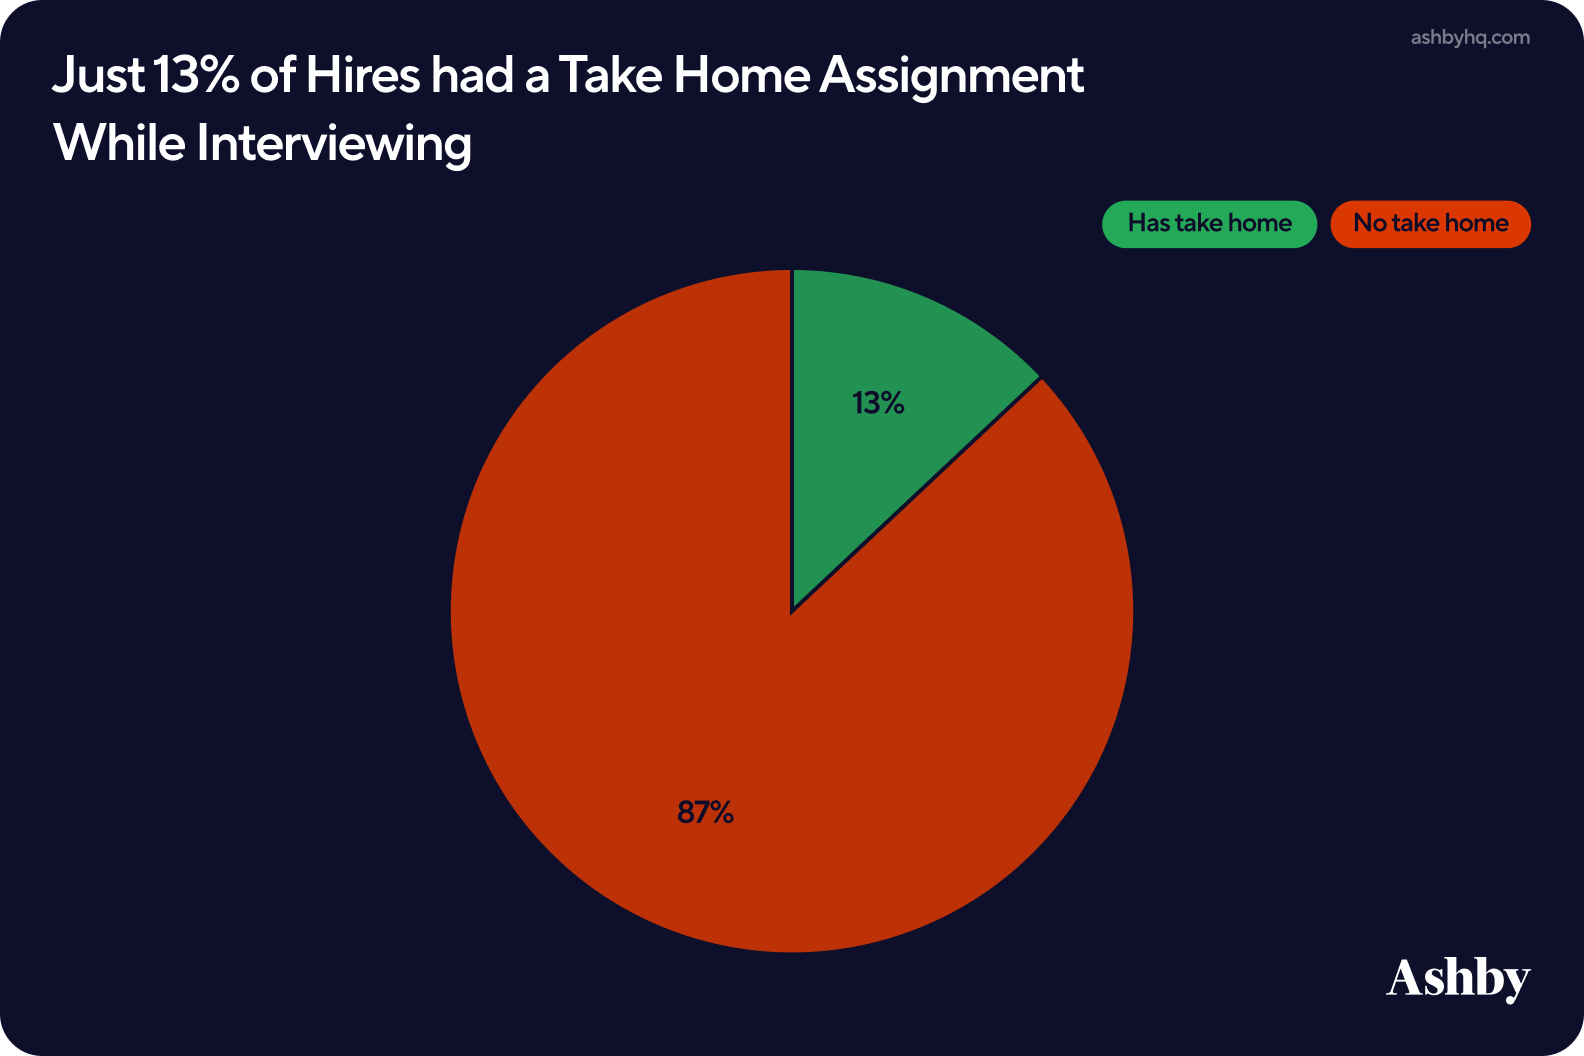
To wrap interviews, we look at take-homes, passthrough rates, and scorecards First, we found that take-homes are not universally used across hiring processes. Around 13% of hires included a take-home component.
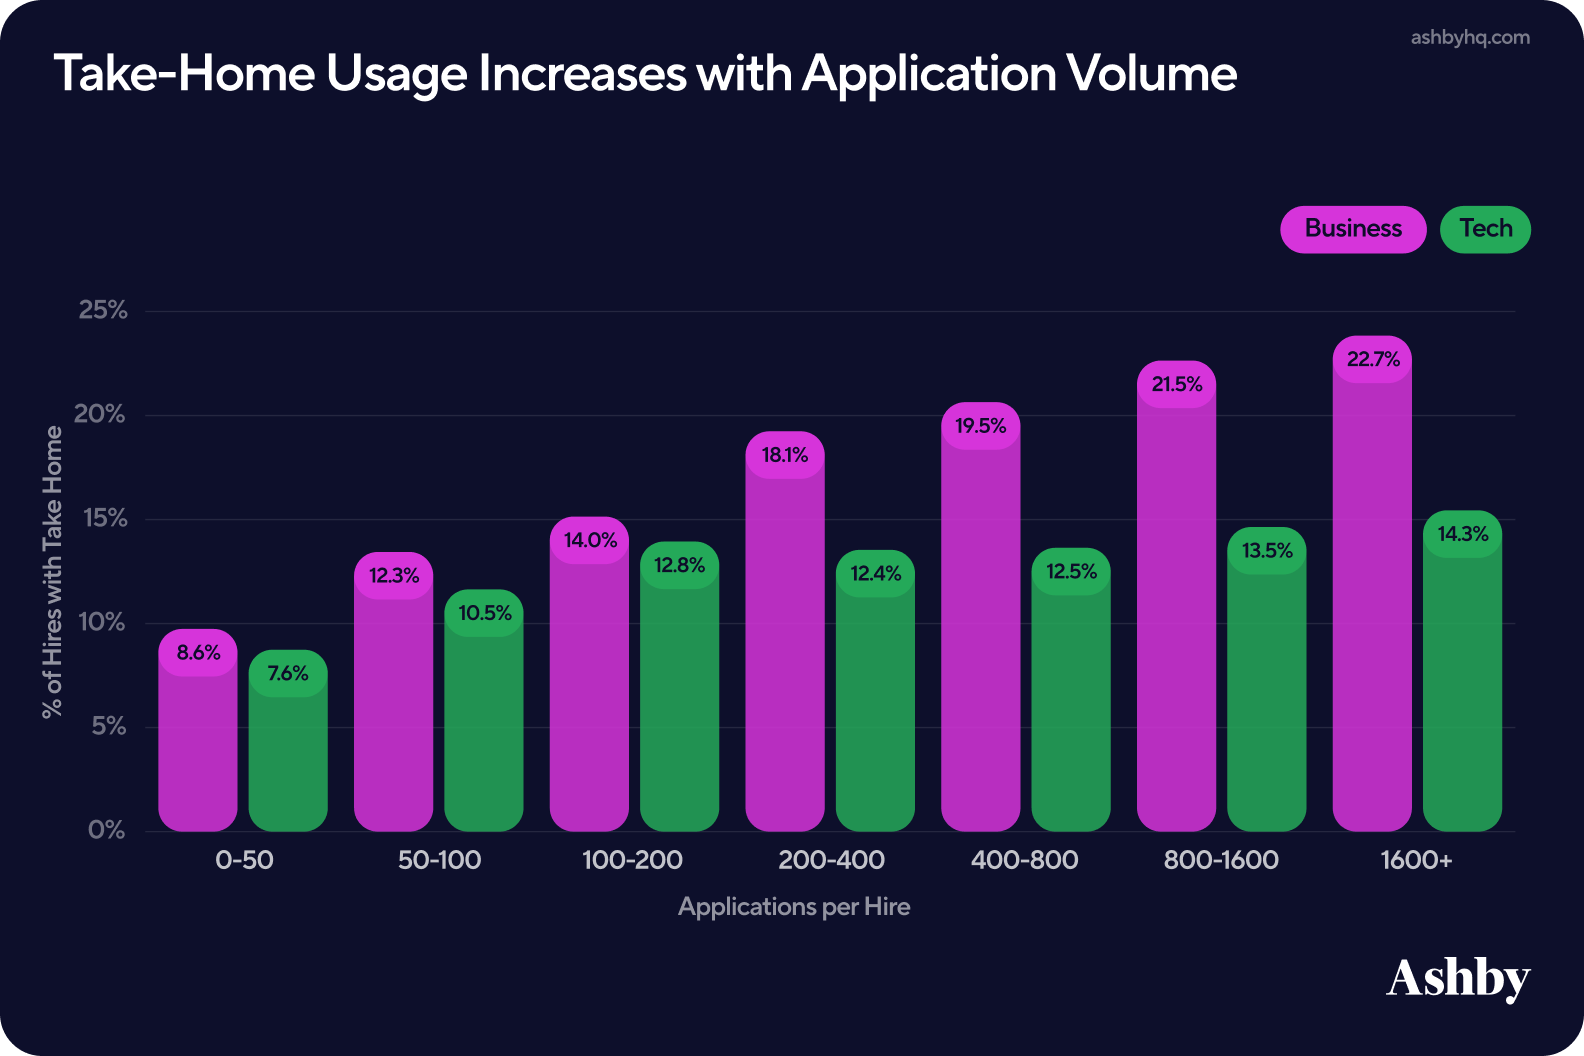
That number, however, shifts meaningfully based on application volume. Roles with higher applications per hire are more likely to include a take-home stage. This pattern is especially pronounced in business roles, where take-home usage climbs steadily from ~8% at lower volumes to over 20% at the highest application ranges. Technical roles tell a different story, staying relatively flat between 10–14% regardless of volume.
Together, this suggests that some teams (particularly in business hiring) lean on asynchronous evaluation as application volume increases and interview capacity becomes constrained.
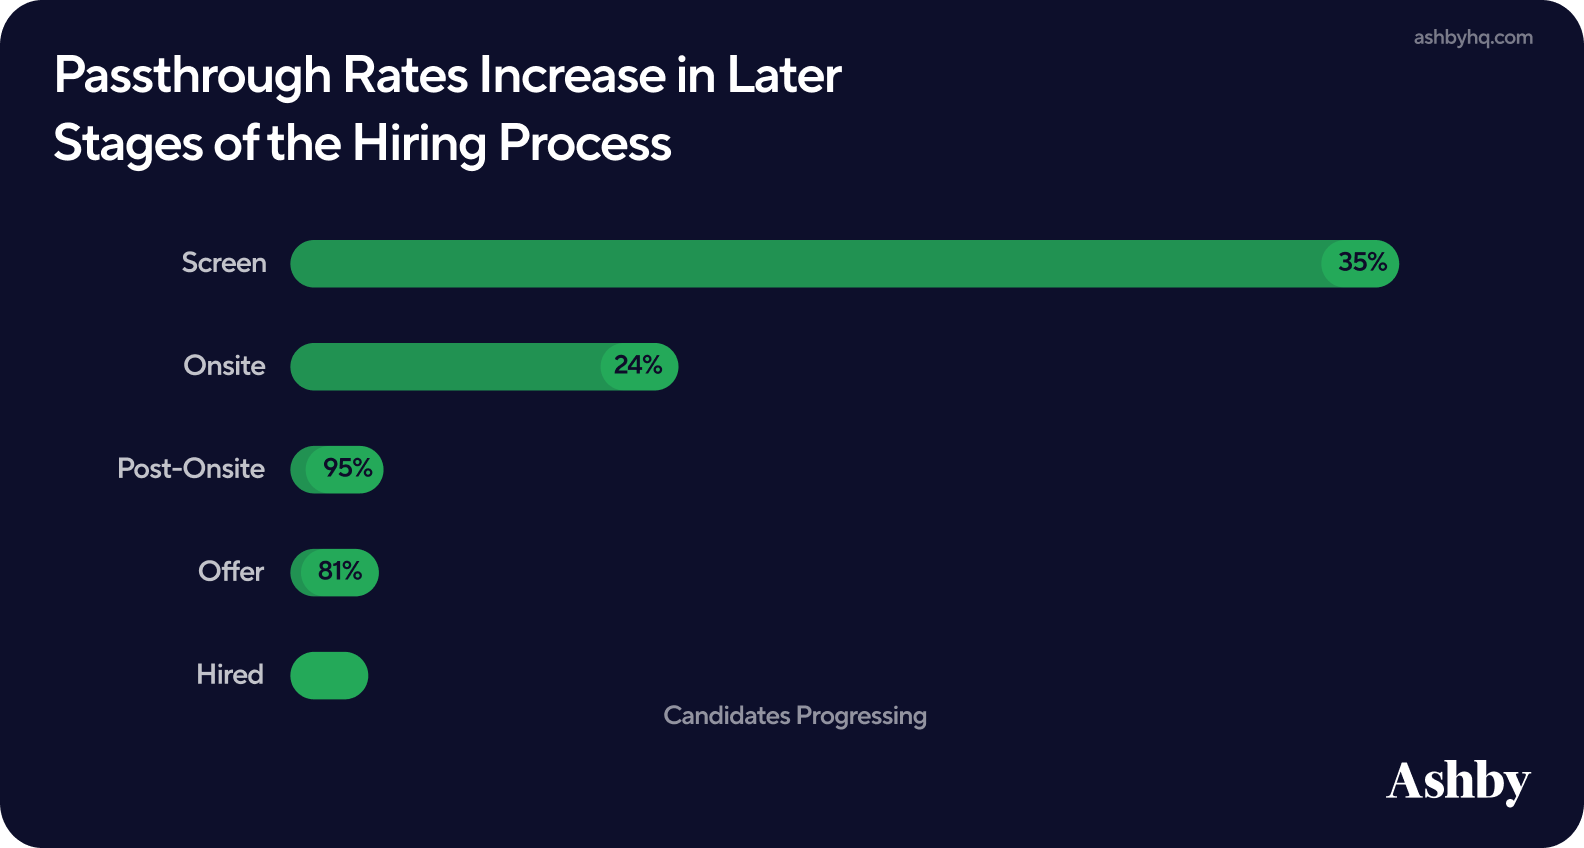
Passthrough rates vary significantly by stage, reflecting how confidence in candidates builds as they move through the process.
- Early stages, such as recruiter screens, see lower passthrough rates (~35%) but handle the highest volume of candidates.
- Later stages, such as post-onsite and offer, see significantly higher conversion rates at 95% and 81%, respectively.
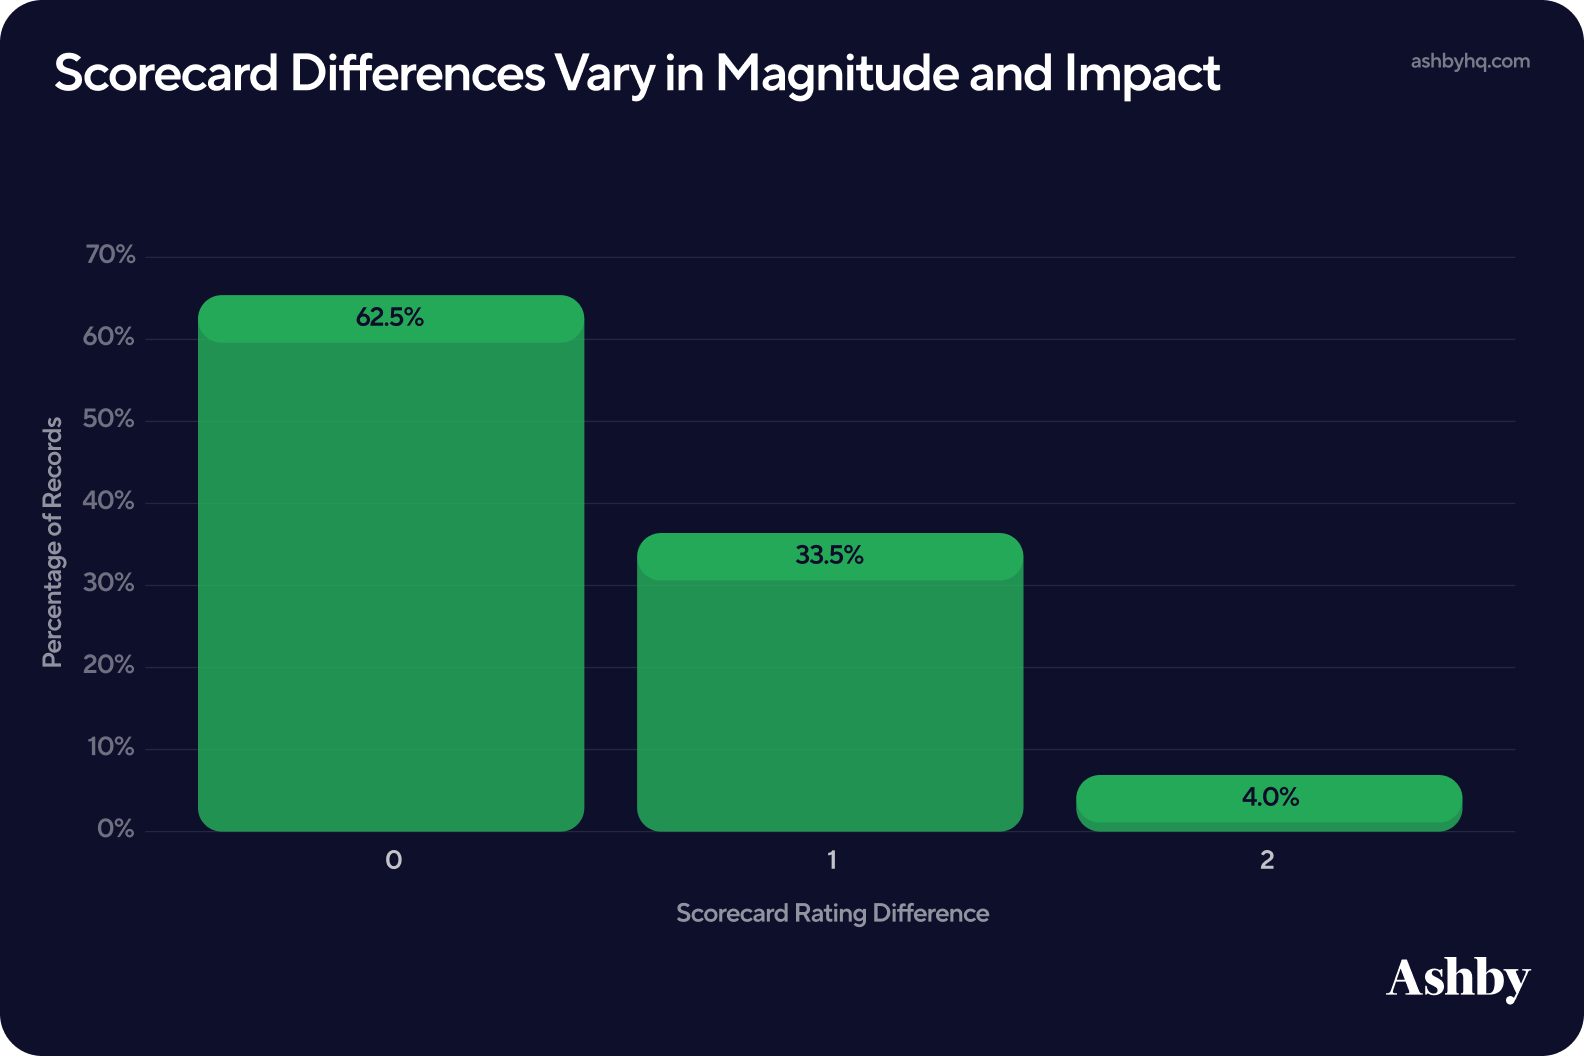
4. Scorecard differences range from minor to meaningful
Strong hiring decisions depend on quality feedback, and that starts with scorecard alignment. To explore this, we examined interviews involving multiple interviewers, then compared the alignment of submitted scorecards. We found around 38% of scorecard pairs include at least one point difference between interviewers. In this context, a scorecard pair simply refers to two scorecards, as we’re looking at the difference between interviewer scores versus one scorecard alone. In many cases these differences are minor, such as a score of 3 v 4, which could still indicate general alignment between interviewers.
However, nearly half of those one point differences fall between 2 and 3, crossing the “yes/no” threshold on Ashby’s 1 to 4 scoring scale. When disagreements cross that line, they tend to increase time in the process and delay hiring decisions. Anecdotally, misalignment within score values typically sparks additional internal conversations, compounding that delay.
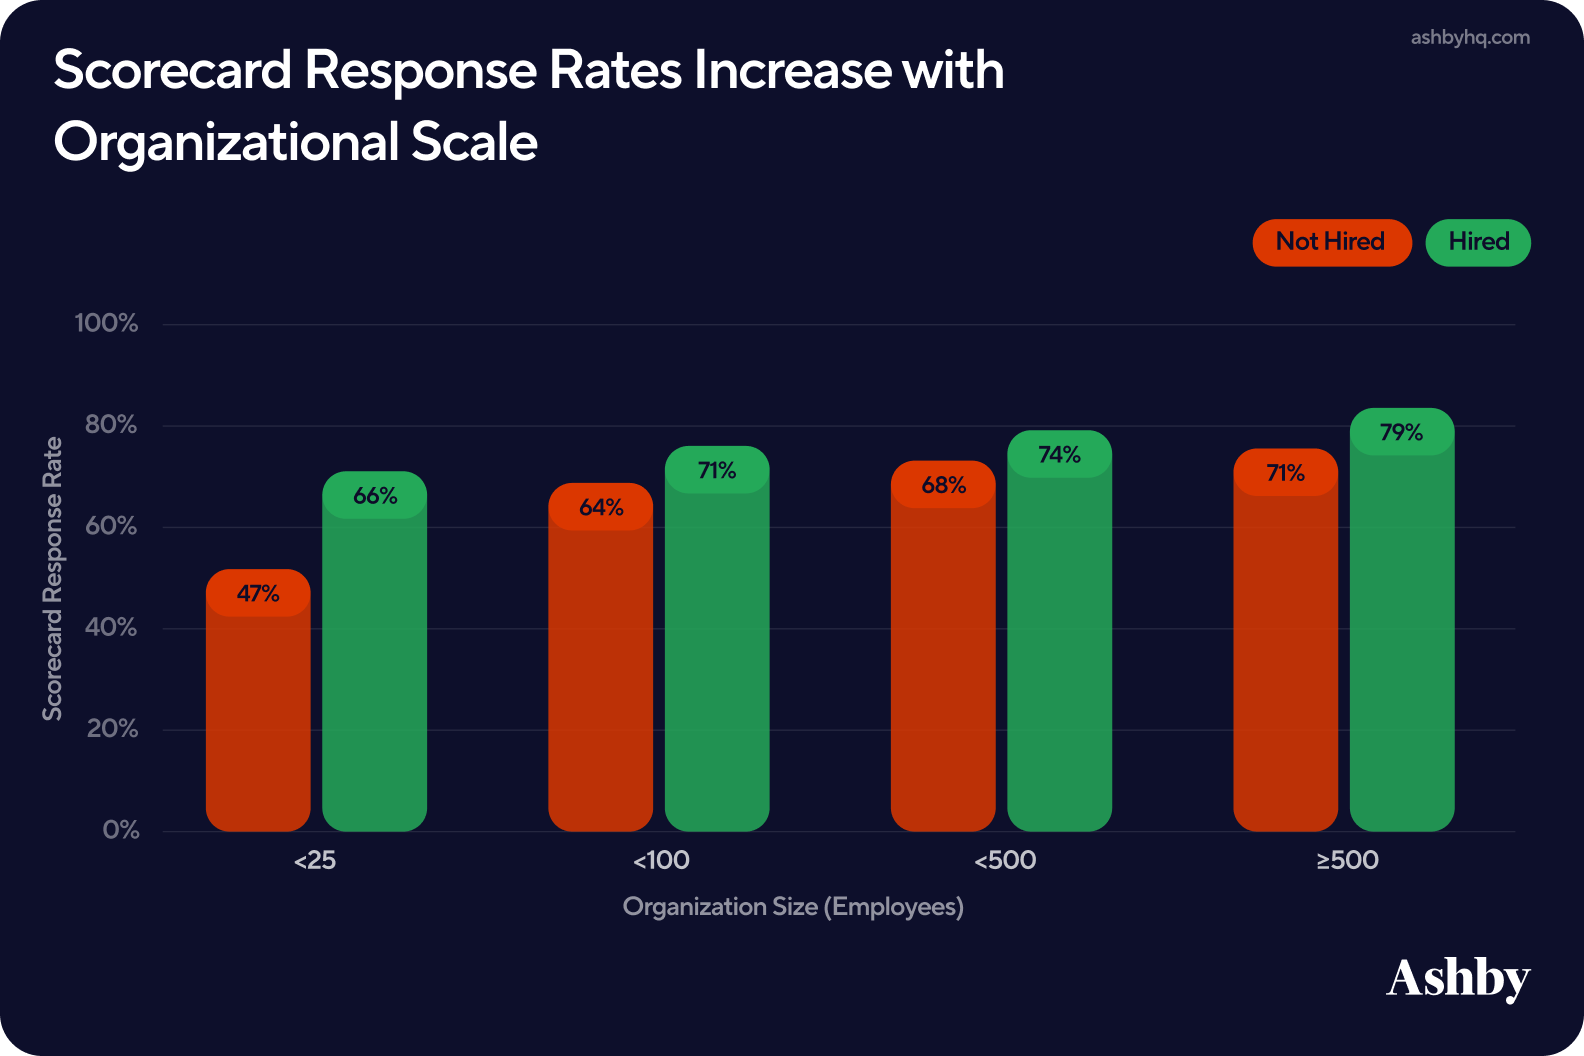
Scorecard response rates vary by organization size. As hiring processes mature, feedback practices tend to become more consistent. Specifically:
- Smaller teams, those with under 25 employees, see completion rates around 49%
- Larger organizations with 500 or more employees achieve rates closer to 72%
It is also worth noting that scorecard completion tends to be higher for hired candidates than for those who are not. Interviewers naturally invest more time in feedback when a candidate has a chance of moving forward, however, incomplete scorecards for rejected candidates can create gaps in the data and limit a team’s ability to learn from patterns across the full pipeline.
This suggests that scorecard discipline is as much a function of process maturity as it is individual interviewer behavior. Below we split this out by outcome.
Taken together, interview structure and signal quality shape not just how long hiring takes, but how effectively teams are able to identify and move forward with the right candidates.
IV. Funnel Strategy: The Impact of Referrals
While earlier sections focused on how candidates move through the hiring process, funnel strategy looks at where candidates come from and how that shapes outcomes.
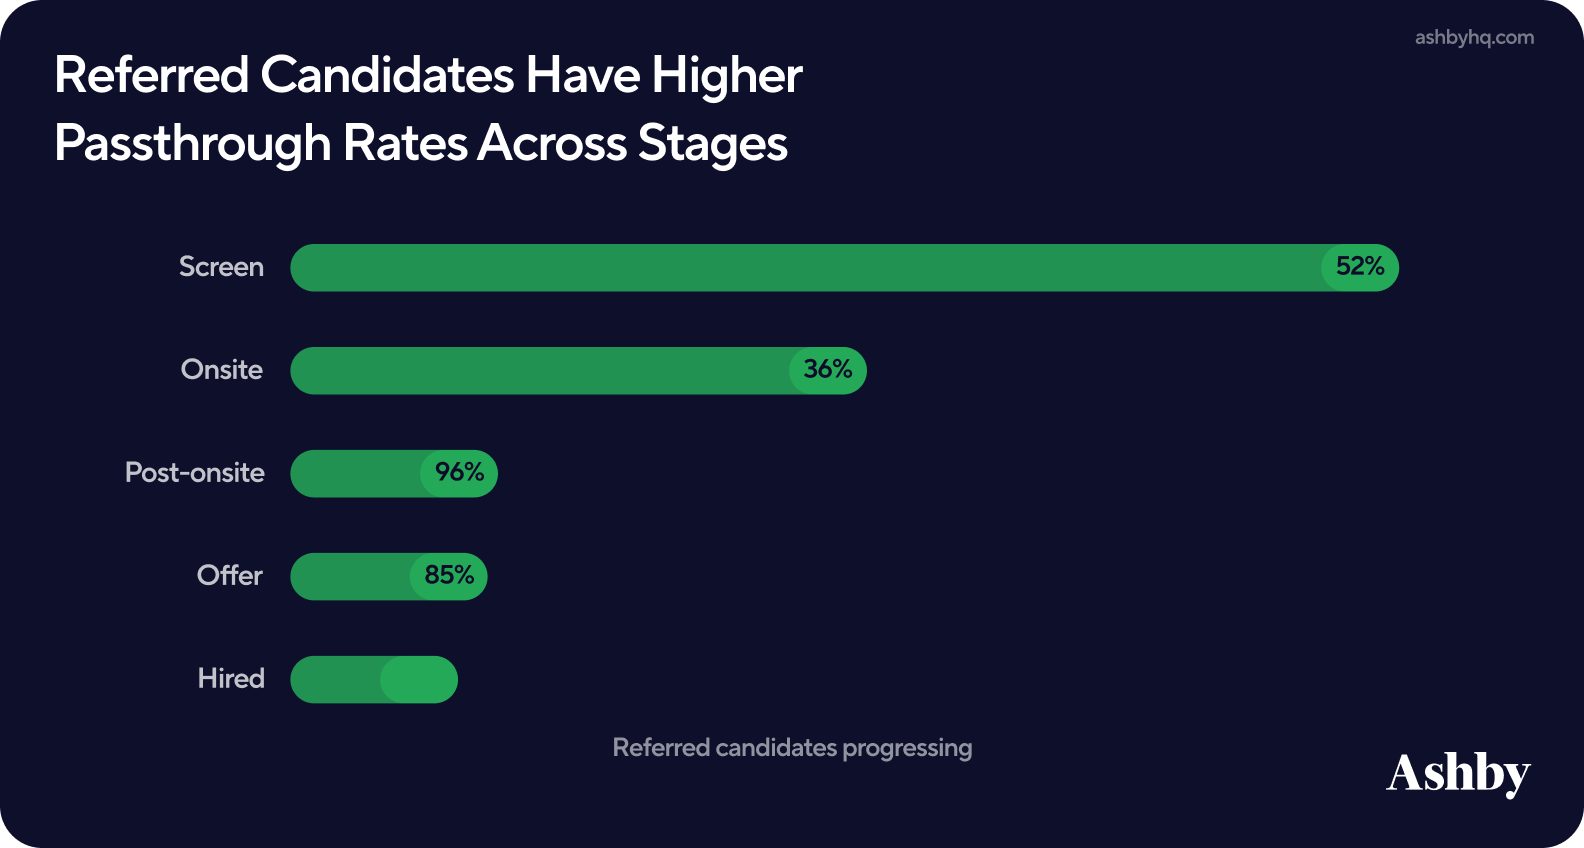
Referrals consistently outperform other sources across the funnel. We find that:
- Referred candidates have higher passthrough rates at nearly every stage of the hiring process.
- 52% of referred candidates pass initial screens compared to 35% overall, and this trend continues through onsite and offer stages.
This indicates that referred candidates enter the funnel with stronger signals from the start, requiring less filtering in early stages and more efficient progression overall.
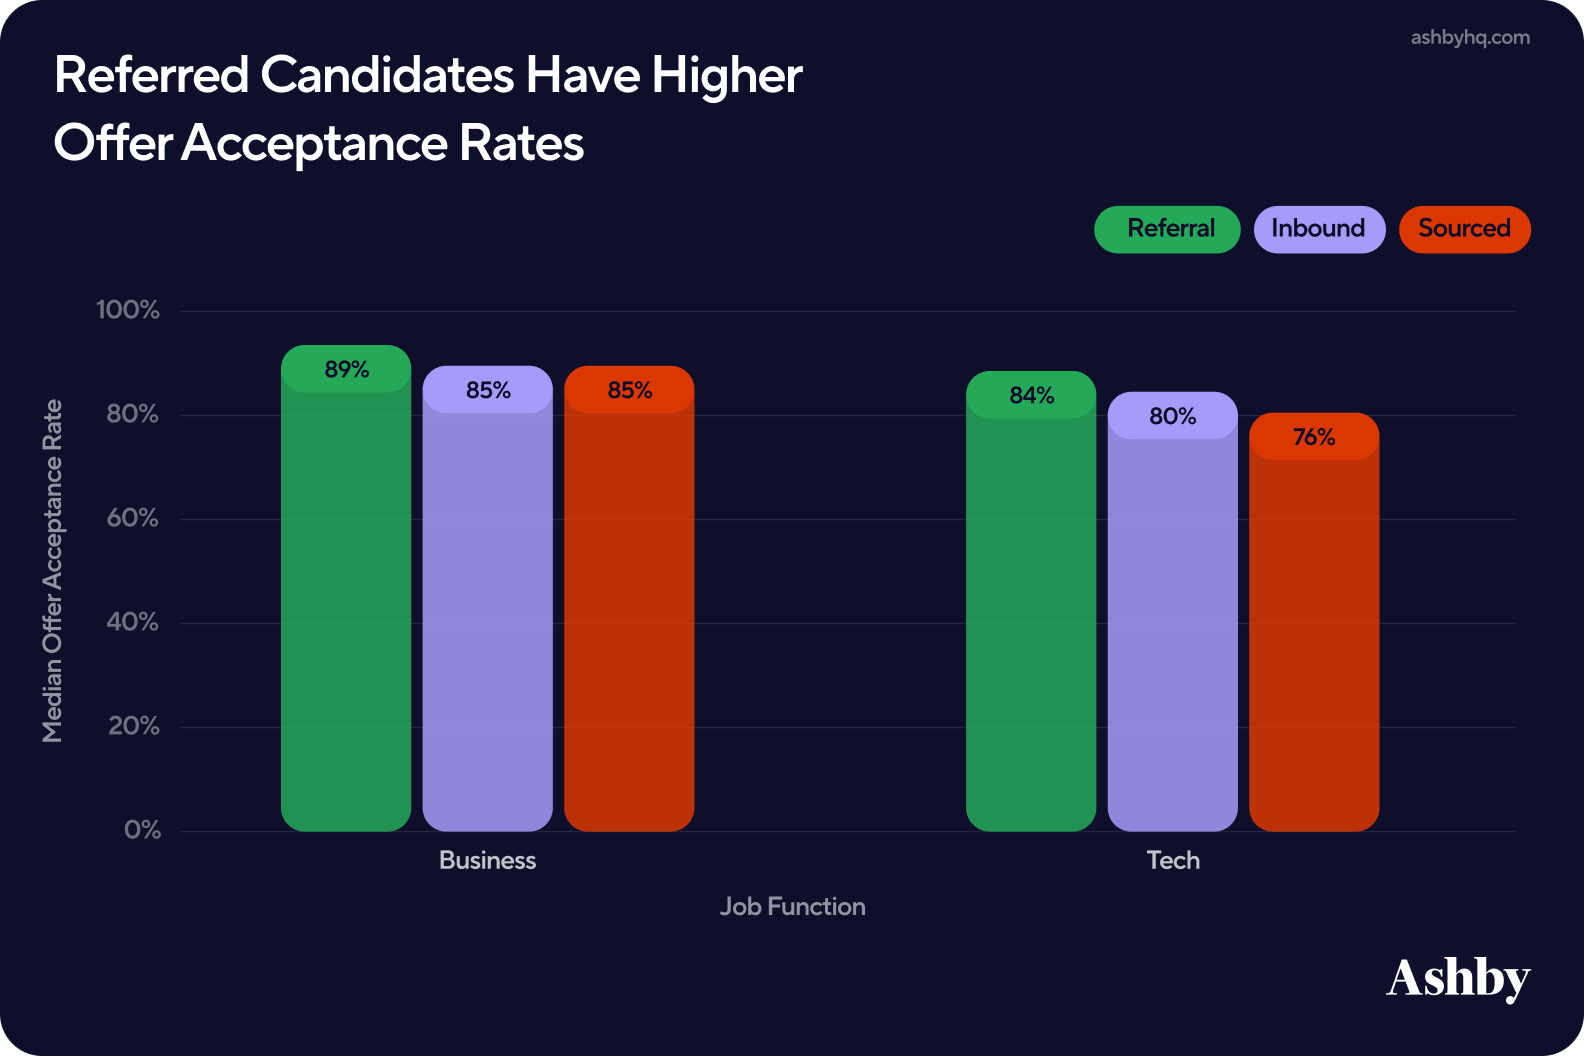
Referrals also outperform other sources at the final stage of the funnel. Referred candidates have higher offer acceptance rates than both inbound and sourced candidates across both business and technical roles.
The gap is especially notable in technical hiring. While all three sources perform similarly in business roles, sourced candidates in tech accept offers at a lower rate than referred candidates. For RecOps, this is a useful signal when thinking about where to invest sourcing efforts and how to set up offer acceptance expectations by source.
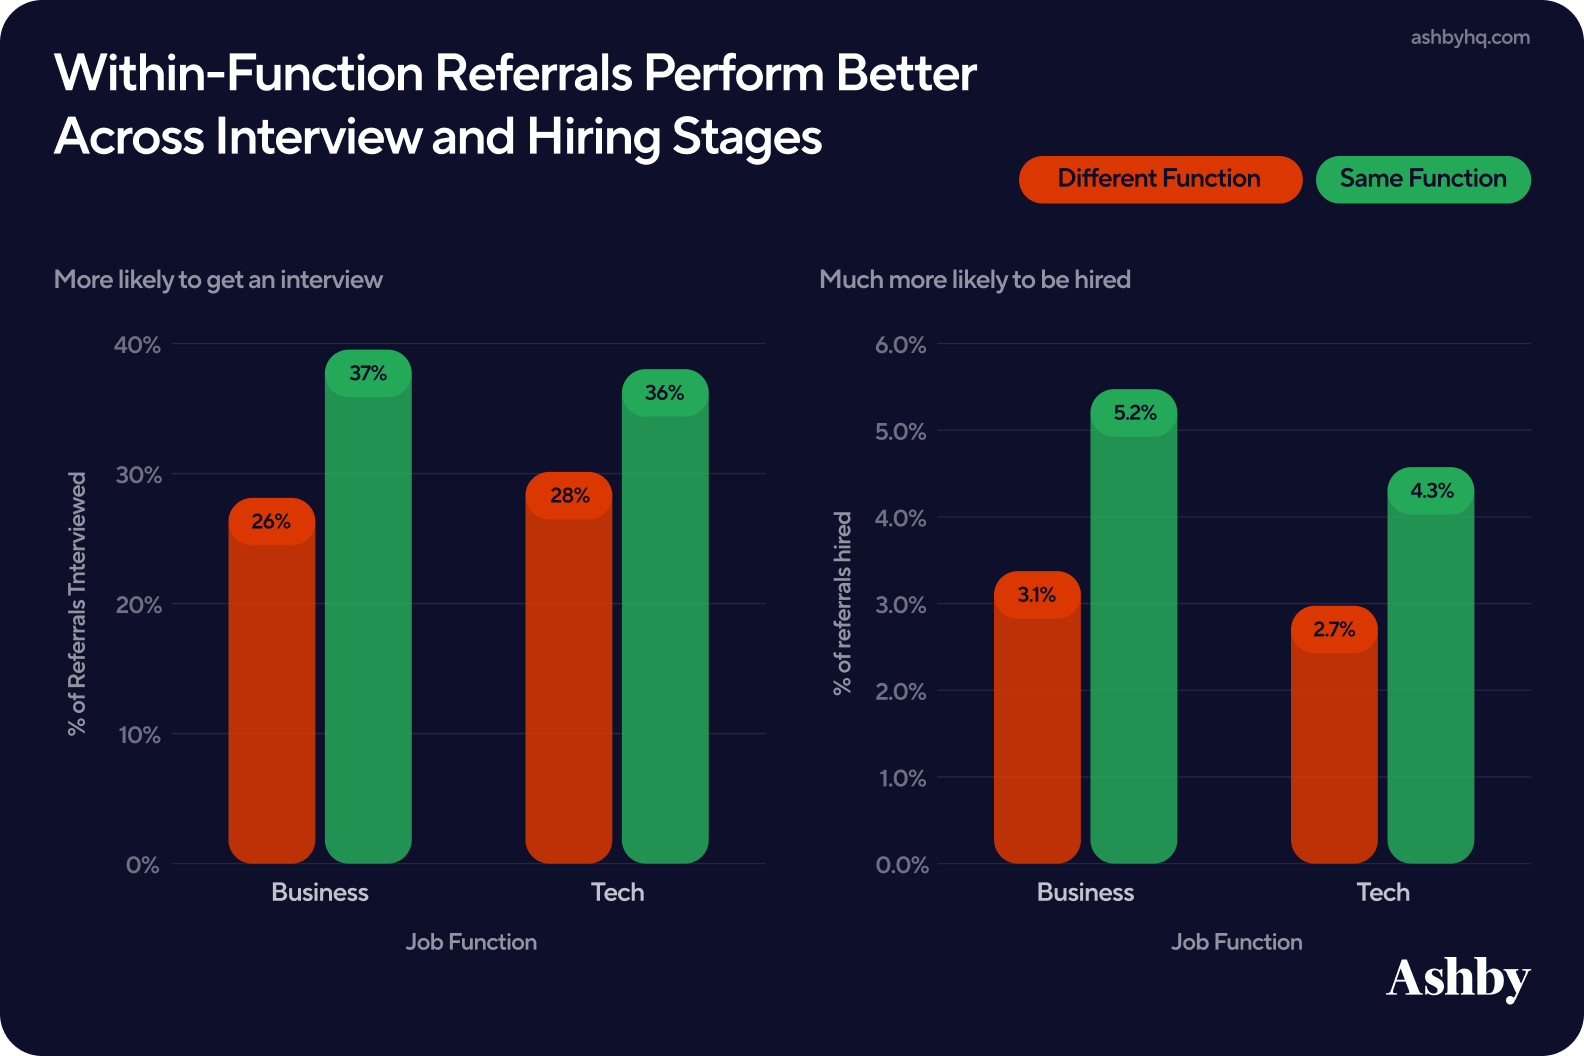
Digging deeper into what drives successful referrals, the data shows that not all referrals perform equally. The referrer’s job function plays a meaningful role in determining outcomes.
- Referrals are more likely to result in interviews when the referrer works in the same job function as the role being filled (e.g. tech referring tech, business referring business).
- This pattern becomes even more pronounced at the hiring stage. While out-of-function referrals are often given an initial opportunity through interviews, their conversion to hires is lower compared to within-function referrals.
While referrals broadly improve funnel performance, alignment between the referrer’s domain and the type of role plays a meaningful role in final outcomes. It is worth noting that out-of-function referrals are not without value, only that they tend to carry less signal comparatively.
This data reinforces the role of referrals as a high-signal source, improving not just candidate quality but overall funnel efficiency. At the same time, sourced candidates perform similarly across many stages, indicating that outbound efforts can also produce strong outcomes when executed well.
These findings also build on our previous analysis, where referrals consistently showed strong conversion rates from application to interview and from interview to offer, second only to internal candidates.
V. Archiving
A hiring process doesn't end when an offer is signed; it ends when every candidate, hired or not, has been properly closed out. For RecOps, Time to Archive is a meaningful KPI that signals data quality, process discipline, and candidate experience.
In this final section, we look at Time to Archive across three dimensions: how it has trended over time, how it is distributed across the candidate population, and how it varies by source. Teaser: A slow archive process muddies your data and affects your employer brand.
Faster Time to Archive Protects Org Reputation
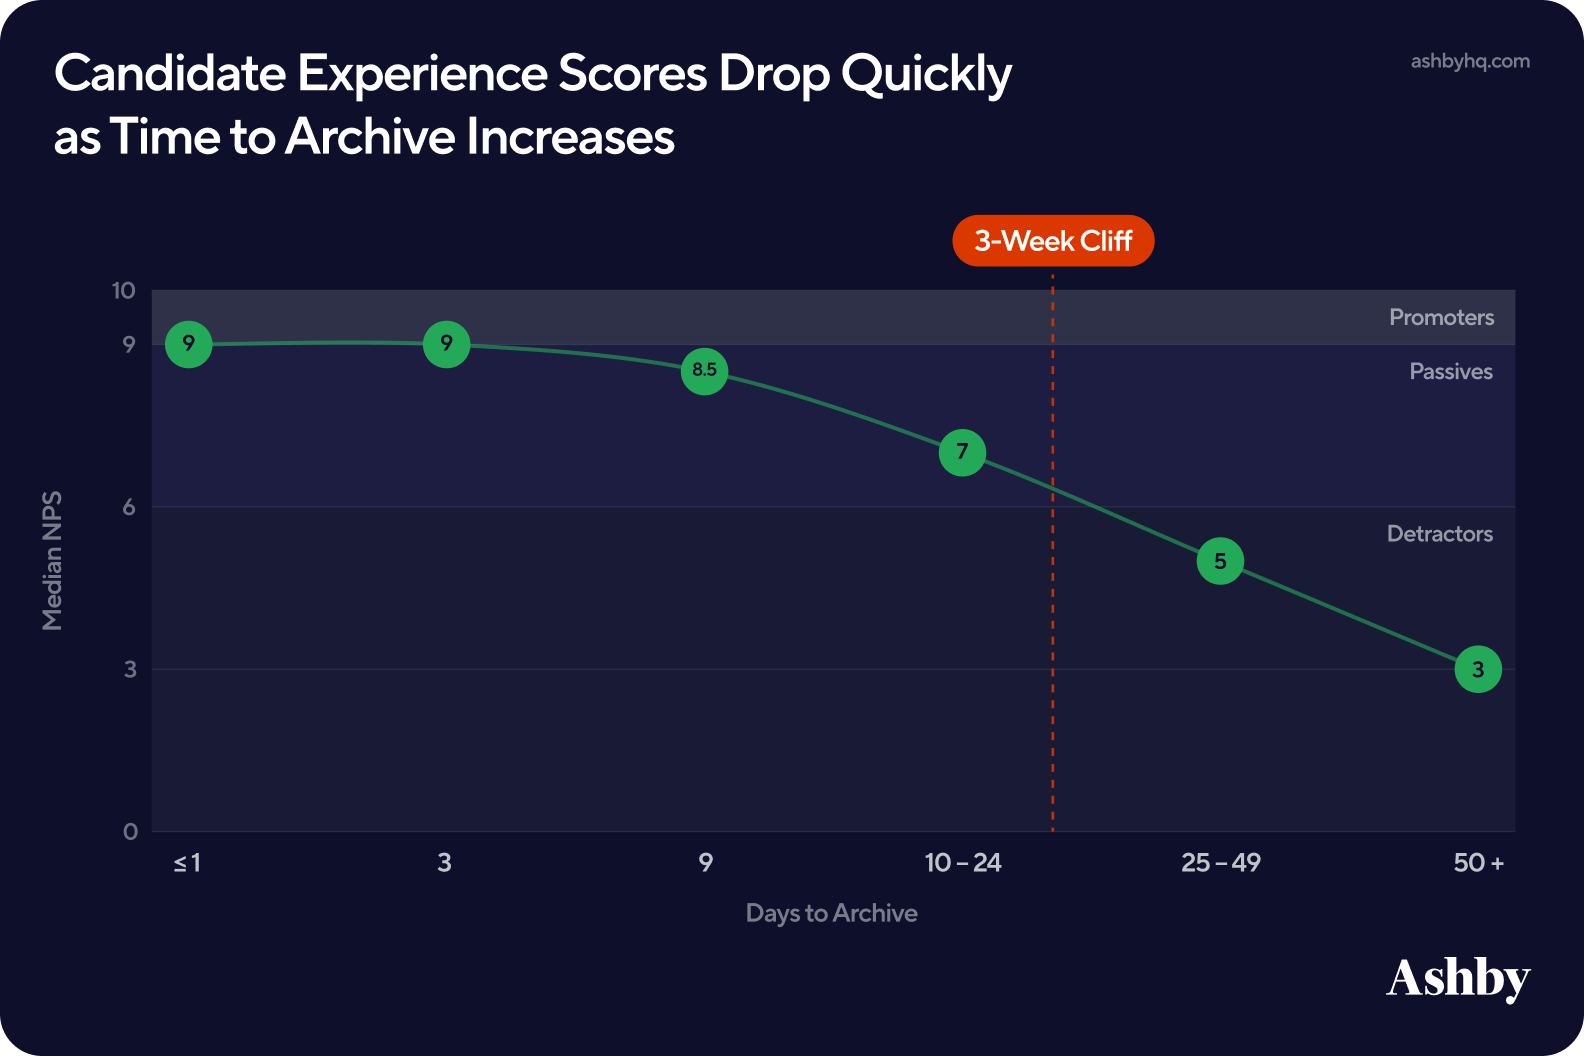
Non-interviewed candidates who are left unarchived submit lower NPS scores than candidates who receive prompt archivals. The sooner your team can archive a candidate, the better your chances are to receive a higher score. There is a chance that companies that provide faster archivals are also more efficient across other points in the hiring process. So while we believe faster archivals are better for your brand, the correlation between Time to Archive and candidate experience scores (such as NPS) likely has many related factors.
For the most part, candidate NPS scores hold relatively steady through the first nine days, but then fall sharply once candidates cross the three-week mark. For RecOps, this is a meaningful threshold to design around:
- Non-interviewed candidates submit a median NPS score of 9 if archived within one day
- If archived by days 10-24, the NPS score falls to 7
- By 50 days or more, the median NPS score is down to 3
As a reminder, NPS scores are calculated on a 0-10 scale where 0-6 represent detractors, 7-8 passives, and 9-10 promoters.
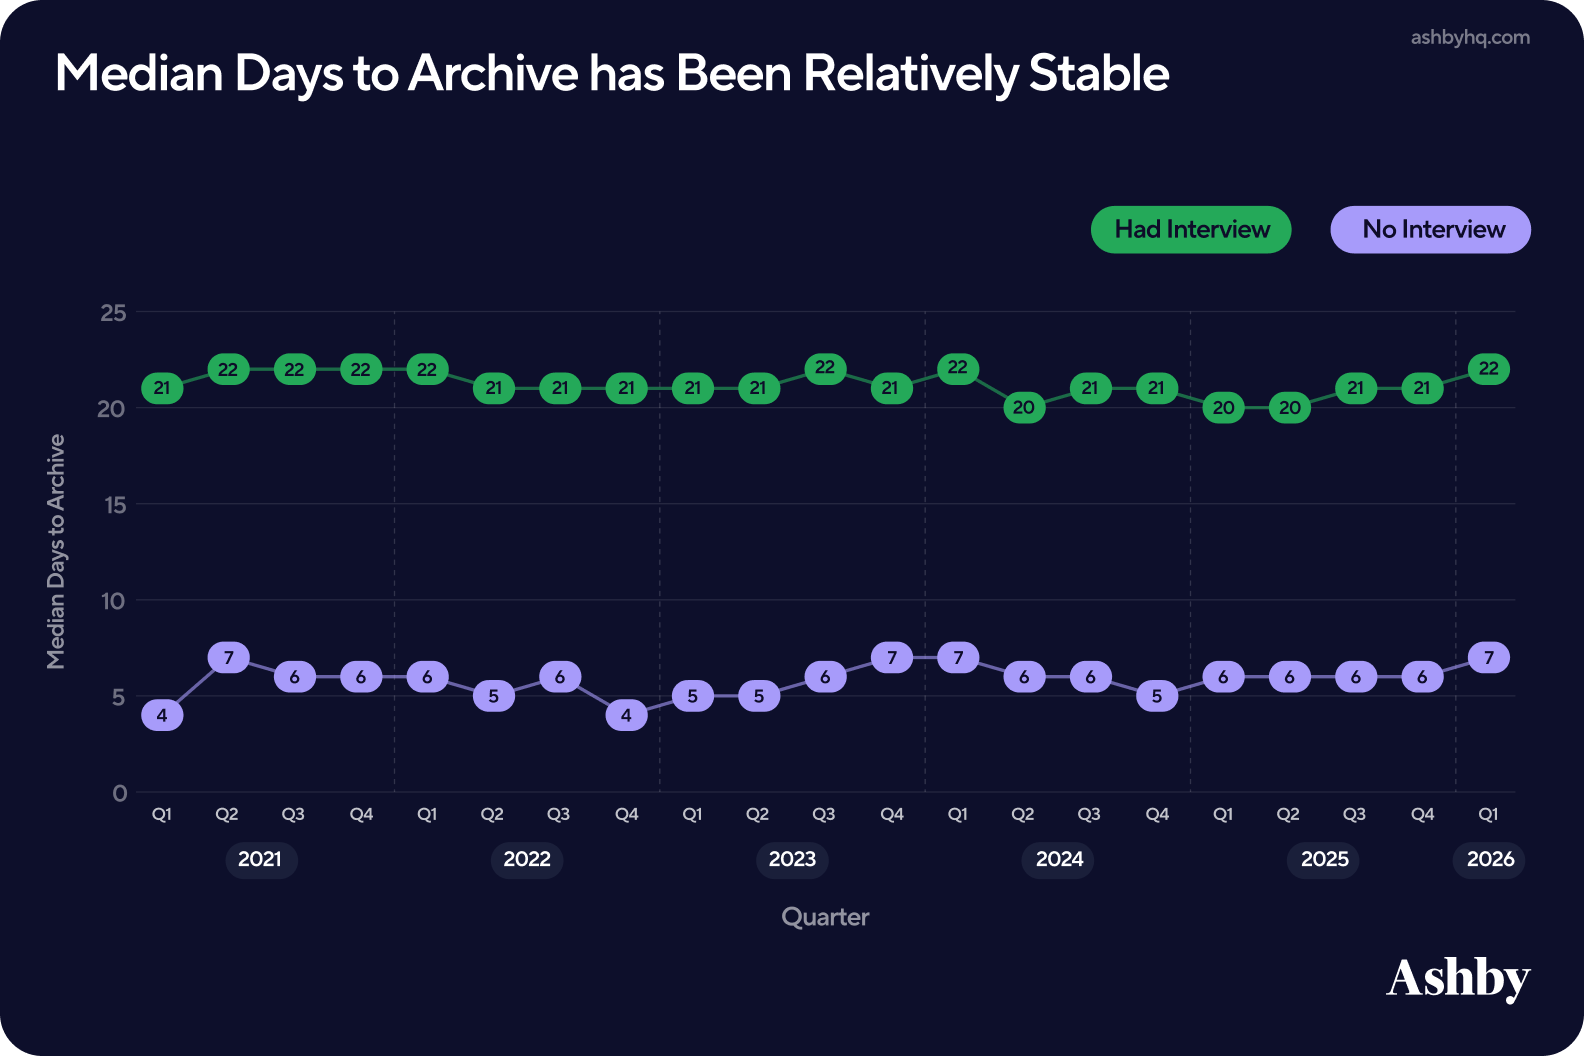
Time to Archive has Remained Relatively Stable
Over the past five years, Time to Archive has remained relatively stable. Non-interviewed candidates are archived in a median ~six days, while interviewed candidates average 21 days. For RecOps, this consistency is useful for benchmarking and setting stakeholder expectations, but it also suggests there is room to optimize. Five years of flat lines points to an opportunity rather than a ceiling.
Candidates who do not advance past the review stage can largely be handled through automatic rules for archiving, but interviewed candidates involve more people and more decisions, naturally extending the time. Both groups warrant different processes and different benchmarks: A six-day standard means something very different to a candidate who never had an interview than the one who made it to the final rounds.
Time to Archive Varies Significantly by Source
Source category is one of the clearest drivers of Time to Archive.
Inbound and referral candidates follow an expected pattern; those without an interview are archived quickly while those who made it further in the process take longer to close out. This reflects the natural rhythm of human decision making and stakeholder involvement. Just as we observed earlier, if the candidate receives an interview, they will naturally take longer to close out.
Meanwhile, sourced candidates are the outliers. Their time to archive is remarkably consistent whether they had an interview or not, averaging 14-17 days either way.
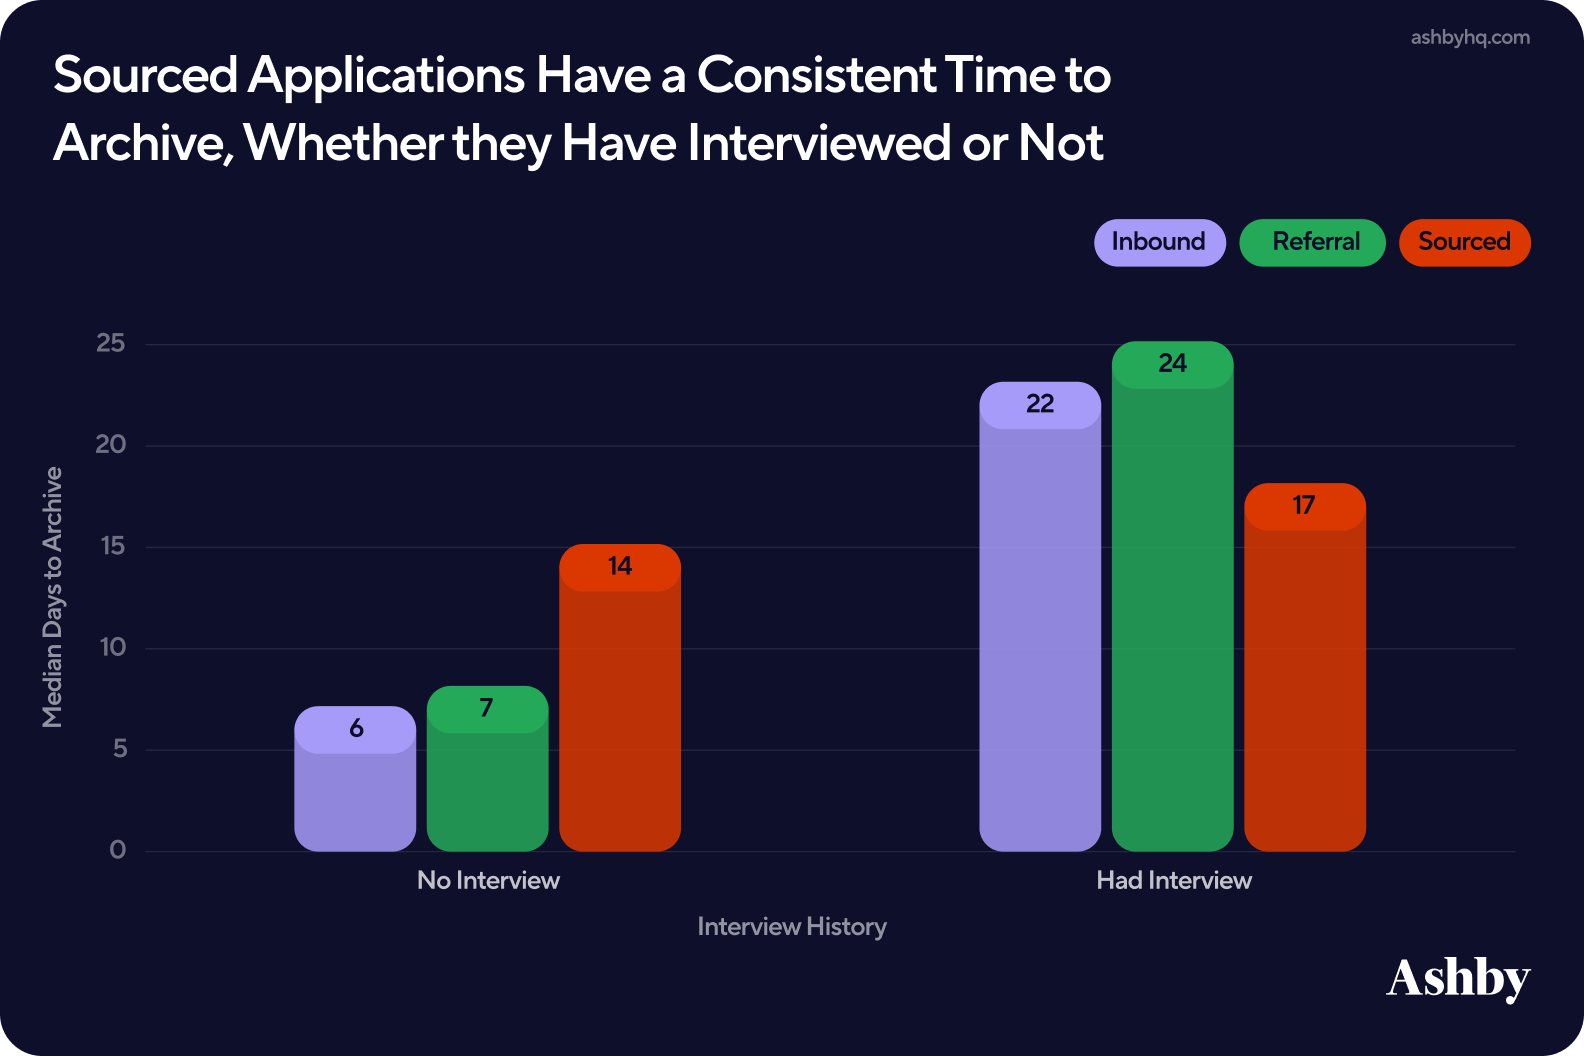
This is more than likely a system behavior rather than recruiter behavior. Sourced candidates are typically managed through outbound workflows, and outreach campaigns set to reach out at regular intervals where that cadence tends to drive archival timing regardless of outcome. If sourced candidates are archiving on campaign cadence rather than intentional rules, workflow automation gives teams the ability to configure source-specific logic, ensuring that Time to Archive reflects a deliberate process decision rather than a by-product of how your outbound sequences are set up.
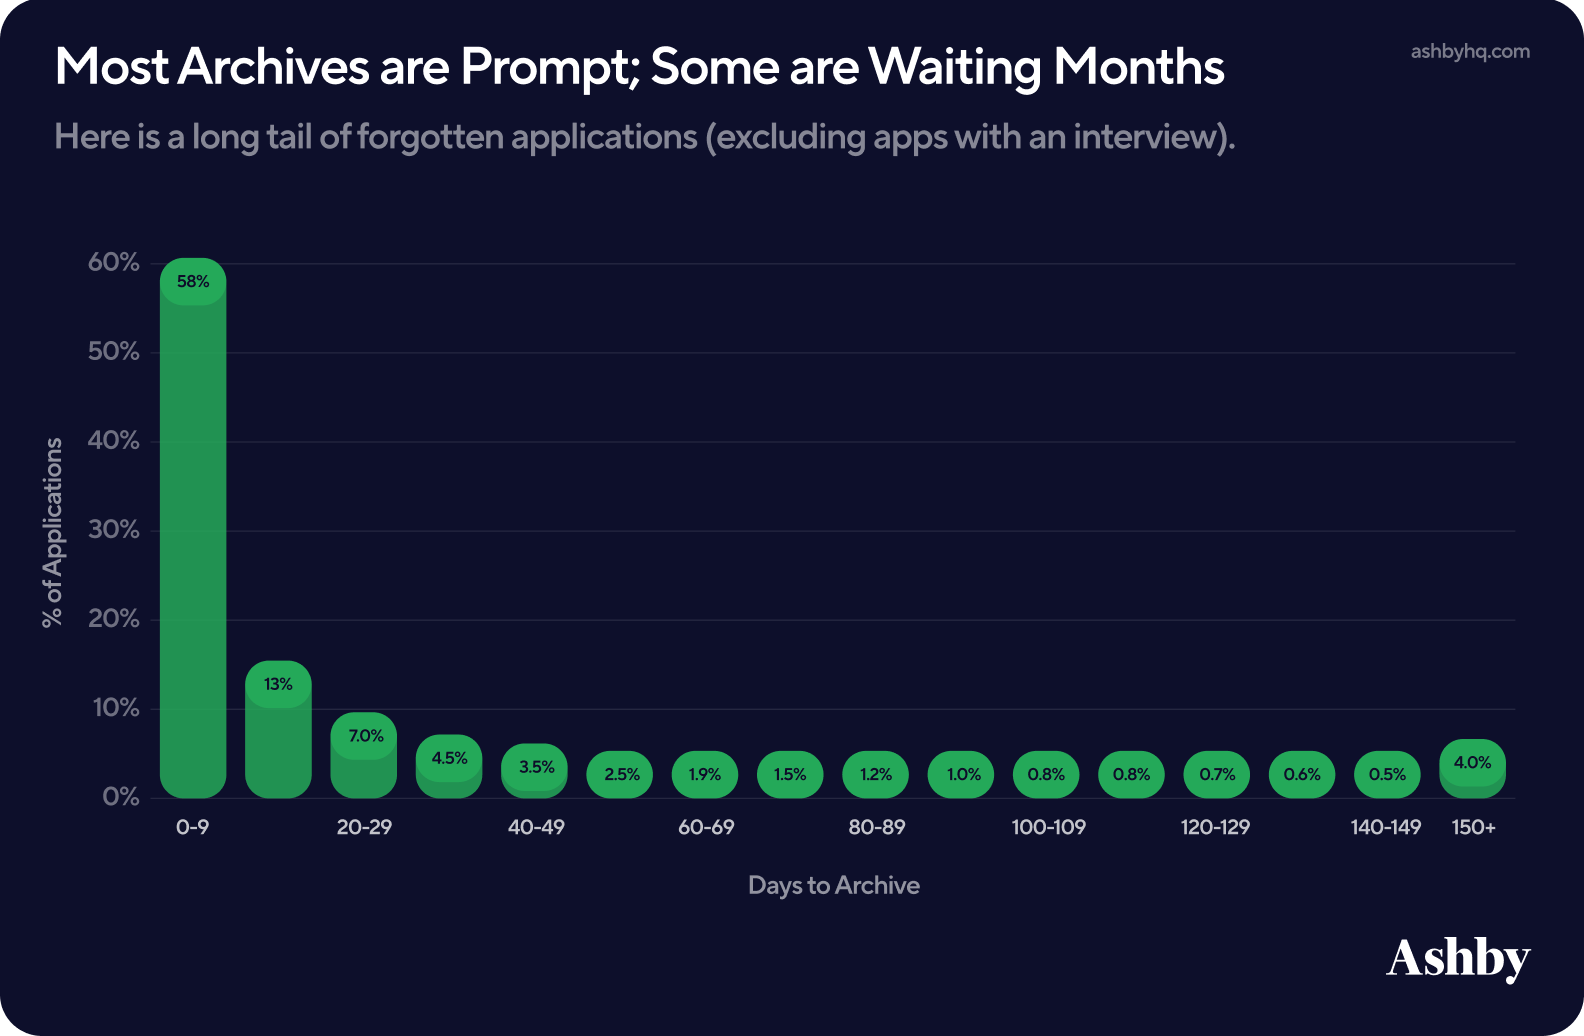
Most candidates are archived quickly, but some are waiting months.
Looking at medians gives us a clean, stable number to report against allowing RecOps practitioners to design systems that best align to the trends. But when we look at the distribution as a whole, an important piece to the puzzle emerges:
- Roughly 58% of non-interviewed candidates are archived within the first 9 days and the numbers drop off quickly from there.
- At 150+ days, archive numbers spike, indicating that a meaningful share of candidates are sitting unarchived beyond a reasonable process window. This spike is something that should not be ignored, as these candidates more than likely fell through the cracks and are not awaiting active hiring decisions.
For RecOps, this is a data quality concern, and for their recruiters, a candidate experience liability. Every candidate sitting in the long tail is a candidate who never got closure.
Ashby’s workflow automation in interview plans allows RecOps teams to configure archival rules that trigger automatically based on stage, source, and time, removing the reliance on recruiters to manually close out candidates. For non-interviewed candidates, this means setting a defined window after which applications are automatically archived, eliminating the forgotten application problem entirely. For interviewed candidates, automatic nudges can surface candidates to recruiters before they drift into the tail, keeping decisions moving without adding administrative overhead.
Conclusion
Through analyzing over 54M applications and 93K jobs from January 2021 through March 2026, we ultimately found:
- Hiring becomes more predictable as organizations scale, with Time to First Fill stabilizing as systems mature
- Time to Hire is shaped by smaller delays across every stage of the process, rather than a single bottleneck
- Interview design and job function play a significant role in efficiency, with factors like scheduling method and panel complexity materially impacting timelines
- Referrals consistently outperform other sources across both passthrough and offer acceptance
For Recruiting Operations teams, these insights shift the focus from optimizing individual steps to designing and maintaining a cohesive system that balances efficiency, signal quality, and candidate experience.
For more recruiting insights and benchmarks, subscribe to our Talent Trends Newsletter.
Other Reports

Offer Acceptance Rates | Talent Trends Report
We analyzed Offer Acceptance Rate (‘OAR’) patterns over a three year period to share valuable insights and benchmarks for talent teams.

The State of Startup Hiring | 2026 Talent Trends Reports
Data from 1,200+ venture-backed startups on AI adoption, remote hiring, application volume, time to hire, and offer acceptance rates.

Subscribe for more talent trends and insights
We will be regularly releasing new reports around trends and insights we're seeing in our data and you will be the first to know.